What Is a Web Analytics API? A Practical Guide
Most people think of web analytics as a dashboard you log into. But behind every dashboard — whether you built it yourself or bought it — there’s an API doing the actual work. A web analytics API is the programmatic interface that lets you request, send, and manipulate analytics data without touching a UI: you write code, the API returns JSON, and you decide what to do with it.
In my 12 years working with analytics platforms, the teams that build on top of APIs stop treating analytics as something to check and start treating it as something to compose. That shift — from passive dashboard consumers to active data builders — is what this guide is about. I’ll cover what web analytics APIs actually are, how authentication works in practice, what code you need to make your first requests, and how the main platforms compare when you’re deciding which one to build on.
I’ll use Plausible, Umami, Matomo, PostHog, and the GA4 Data API as concrete examples — they’re the most relevant options today and each makes different design choices worth understanding.
What a Web Analytics API Actually Is
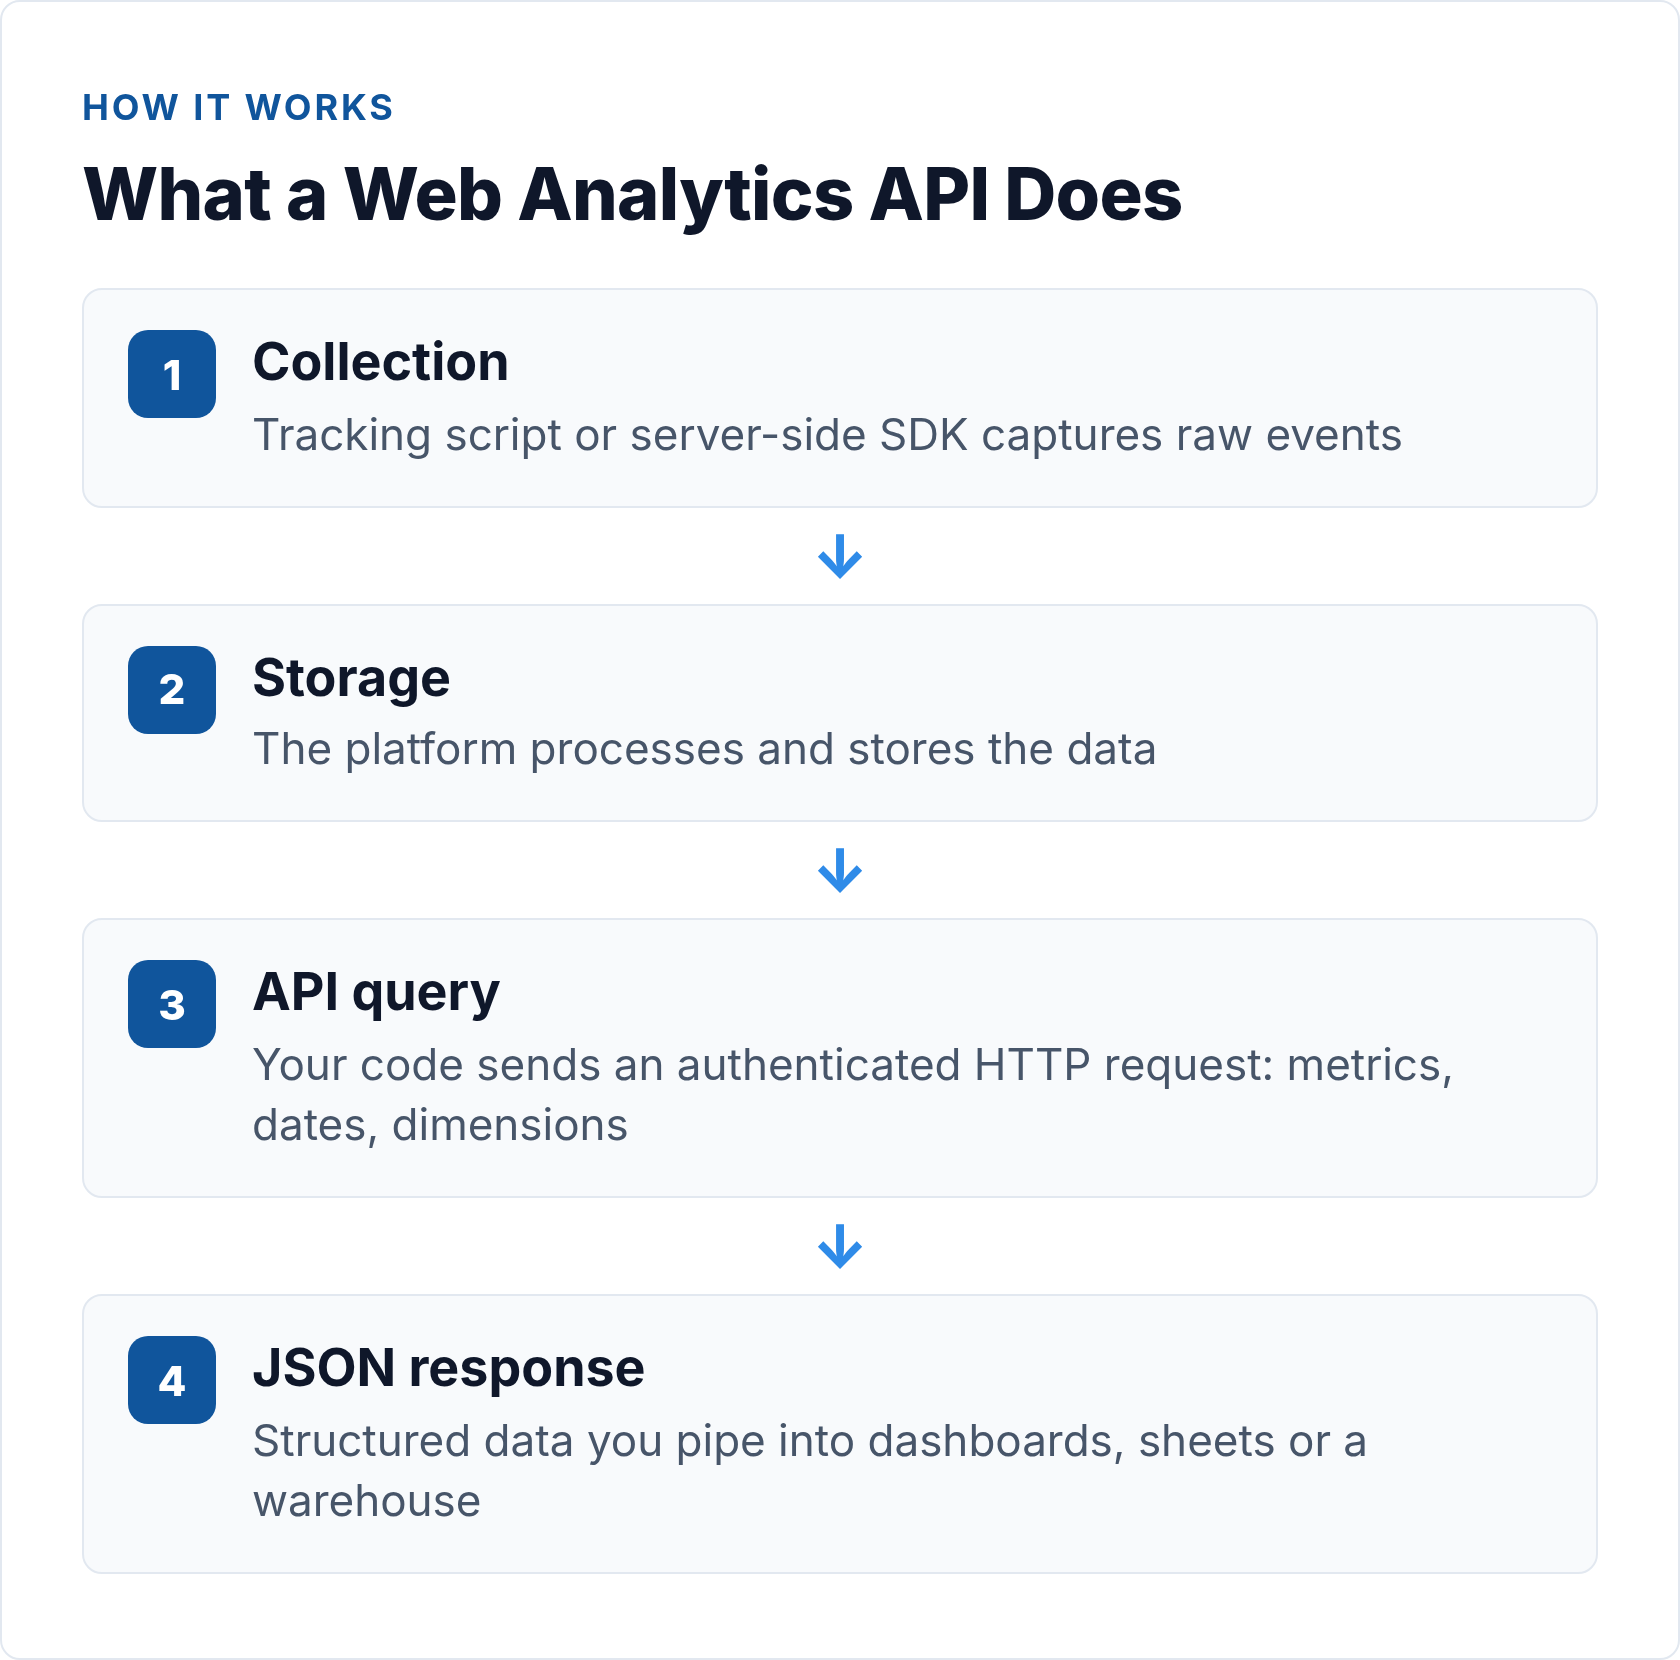
An API (Application Programming Interface) is a defined contract between your code and a remote service. You make an HTTP request to a specific URL with specific parameters; the service returns structured data — almost always JSON in modern analytics APIs.
What it’s not is the tracking script or pixel that collects data in the first place. The collection layer and the query layer are separate. Your analytics platform ingests events — pageviews, clicks, custom actions — and stores them. The API gives you programmatic access to that stored data, or lets you pipe events in server-side, bypassing the browser entirely.
This guide focuses on the query and reporting side. If you’re building a server-side collection pipeline, the complete guide to server-side tracking without cookies covers that layer in detail.
Why Teams Build on Web Analytics APIs
There are four distinct use cases, and they call for different approaches.
Custom dashboards
You want analytics data displayed somewhere other than the default platform UI — inside your product, in a client portal, on a screen in the office. The API lets you pull specific metrics and render them however you want. This is the most common starting point.
Automated reporting
Scheduled reports that run without anyone clicking “export” are one of the highest-leverage things a small analytics team can build. You query the API on a schedule, format the output, and deliver it to Slack, email, or a spreadsheet. No dashboard login required.
Data pipelines and warehousing
Moving analytics data into a central warehouse — Postgres, BigQuery, Snowflake — so it can be joined with CRM data, revenue data, or product events. The web analytics API is your extraction layer: pull, transform, load on a schedule.
Server-side event capture
Some analytics APIs accept incoming events, not just serve queries. If you’re tracking server-side actions that never touch a browser — purchases, background jobs, API calls — you send them directly to the capture endpoint. Matomo’s tracking API and PostHog’s capture endpoint both work this way, giving you complete event coverage independent of browser state or ad blockers.
REST vs GraphQL in Analytics APIs
Most analytics APIs are REST APIs. GraphQL exists and solves real problems, but it hasn’t displaced REST in this space. Here’s how they compare in practice:
| Characteristic | REST | GraphQL |
|---|---|---|
| Endpoint structure | Multiple URLs, one per resource (/stats, /events, /pageviews) |
Single endpoint (/graphql), query in request body |
| Data shaping | Server defines response shape; you filter by parameters | Client specifies exactly which fields to return |
| Over/under-fetching | Common — response may include fields you don’t need | Avoided by design — get exactly what you ask for |
| Caching | HTTP-native (GET requests cache easily) | More complex — POST requests don’t cache by default |
| Learning curve | Low — HTTP verbs + URL patterns | Higher — requires learning query syntax |
| Analytics examples | Plausible, Matomo, Umami, GA4 Data API | PostHog (HogQL), custom implementations |
For most analytics integrations, REST is simpler and sufficient. The main time GraphQL wins is when you need highly specific field subsets from complex nested data. PostHog’s HogQL endpoint is a good example: SQL-style queries over event data that gives you fine-grained control over what comes back. See MDN’s HTTP overview for a solid grounding in how these requests work at the protocol level.
Comparing the Main Web Analytics APIs
Before diving into code, here’s how the major platforms stack up on the dimensions that matter most when you’re choosing what to build on. This is the quick-reference view — I’ll go deeper on each below.
| Platform | API / Endpoint Base | Auth Method | Rate Limit | Data Format | Free Tier |
|---|---|---|---|---|---|
| Plausible | plausible.io/api/v2/query (POST) |
Bearer token in Authorization header |
600 req/hr (Cloud default) | JSON | No (paid plans only; self-host is free) |
| Umami | Cloud: api.umami.is/v1/Self-hosted: your domain /api/ |
Cloud: x-umami-api-key headerSelf-hosted: login token (Bearer) |
Not published; self-hosted = your server | JSON | Yes (self-hosted, MIT licence; Cloud has free tier) |
| Matomo | Your domain /index.php?module=API |
token_auth param or header (POST preferred) |
Configurable server-side | JSON, XML, CSV, TSV | Yes (self-hosted; Matomo Cloud is paid) |
| PostHog | app.posthog.com/api/projects/{id}/ |
Bearer token (personal API key) | Varies by plan | JSON | Yes (1M events/month on Cloud free tier) |
| GA4 Data API | analyticsdata.googleapis.com/v1beta/ |
OAuth 2.0 or service account (Google Cloud) | Per property (quota system) | JSON | Yes (included with GA4 free) |
For a deeper side-by-side evaluation at the product level, the full comparison of the best web analytics APIs covers selection criteria, self-hosting considerations, and which use cases each platform handles best.
Authentication: How Each API Handles It
Auth is where most analytics API integrations first go wrong. The pattern you use depends on the platform and who owns the data. Here’s the practical breakdown.
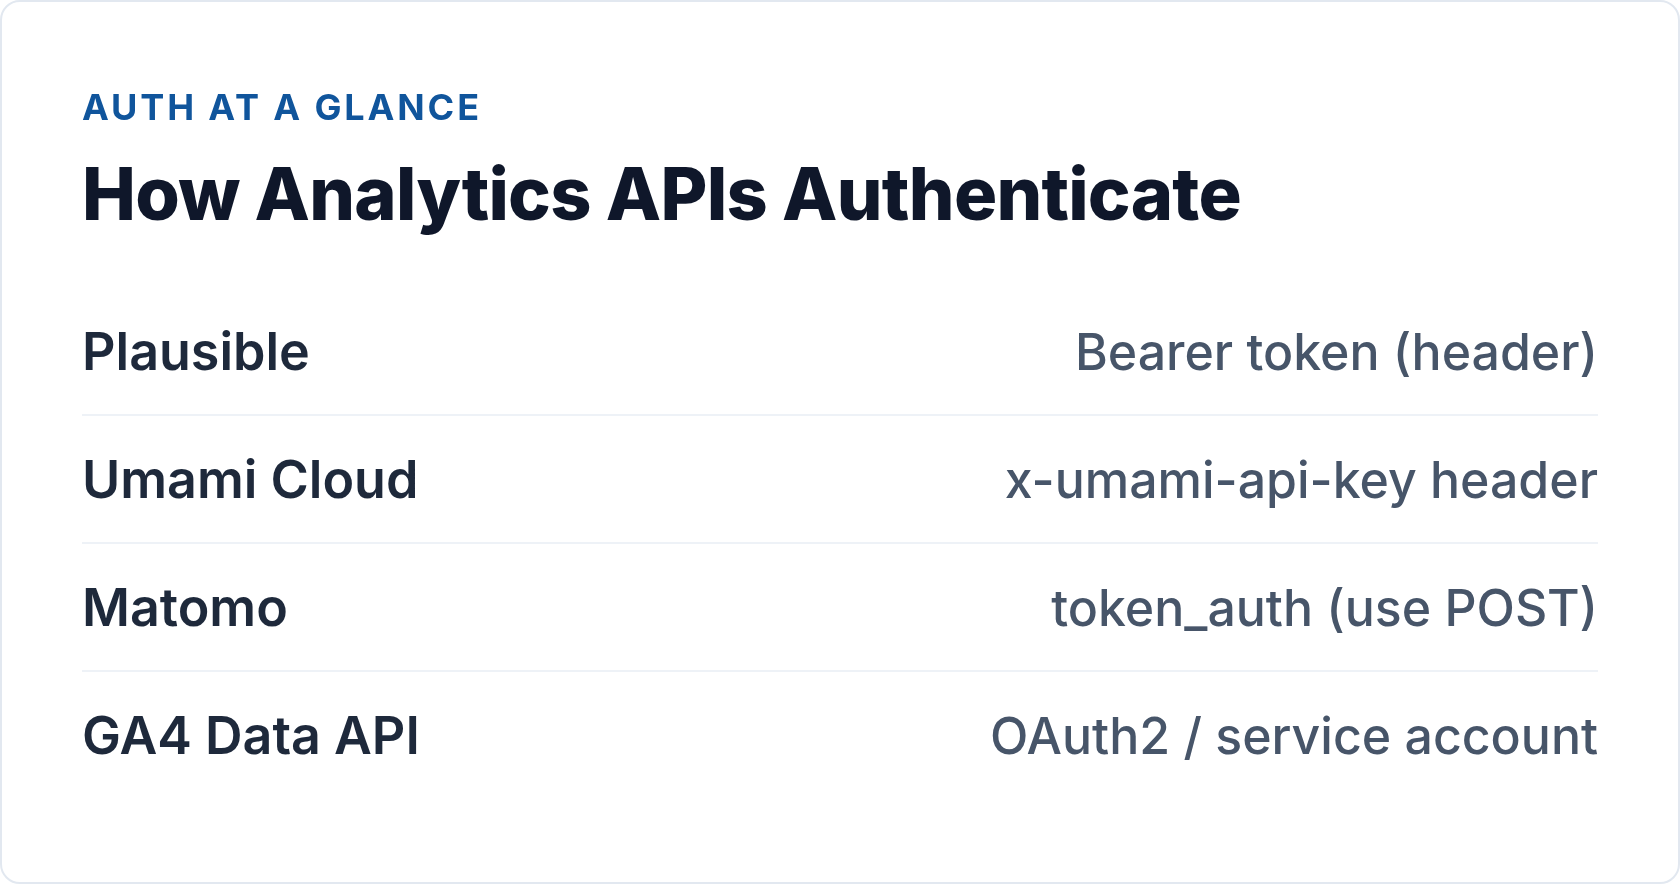
Bearer token (Plausible, PostHog)
You generate a key in the platform settings and send it in every request as Authorization: Bearer <key>. The key never appears in URLs or server logs. Preferred pattern for server-side scripts because it’s simple and secure. Plausible and PostHog both use this model.
For everything about generating, rotating, and scoping analytics API keys, the dedicated guide on analytics API authentication methods goes into the full detail — including when to use scoped read-only keys versus admin keys and how to store credentials safely.
Custom header (Umami Cloud)
Umami Cloud uses x-umami-api-key: <key> — functionally the same as a Bearer token but a non-standard header. Still server-side only; still never put it in client-side JavaScript.
Login-then-token (Umami self-hosted)
Self-hosted Umami requires POST /api/auth/login with username and password to get a session token, then uses that as a Bearer on subsequent requests. Token has a session lifetime, so automated scripts need to re-authenticate periodically or catch 401s and refresh.
Query parameter (Matomo)
Matomo uses token_auth=<token>. It works — but when passed as a GET parameter, your token appears in web server access logs and browser history. Always prefer POST with Matomo and pass token_auth in the request body.
OAuth 2.0 / service account (GA4 Data API)
Required when querying data on behalf of a user who owns a GA4 property. For server-to-server integrations, a service account is the practical path — but it still means a Google Cloud project, a JSON credentials file, and granting the service account read access to each property. More overhead than any of the open-source options, justified only if GA4 is your primary analytics platform.
Universal rule: keep API credentials server-side. Never put an analytics API key in client-side JavaScript — it will be extracted and abused. Proxy requests through your own backend if you need to serve analytics data to a browser.
Code Examples: Your First Web Analytics API Requests
Let’s make this concrete. Here are working curl examples for three of the main platforms.
Plausible: POST /api/v2/query
Plausible’s current API is built around a single POST endpoint. You describe what you want in the JSON body — site, metrics, date range, and optional dimensions or filters.
# Aggregate stats: visitors + pageviews + bounce rate for last 30 days
curl -X POST https://plausible.io/api/v2/query \
  -H "Authorization: Bearer YOUR_API_KEY" \
  -H "Content-Type: application/json" \
  -d '{
    "site_id": "yoursite.com",
    "metrics": ["visitors", "pageviews", "bounce_rate"],
    "date_range": "30d"
  }'

# Break down by traffic source
curl -X POST https://plausible.io/api/v2/query \
  -H "Authorization: Bearer YOUR_API_KEY" \
  -H "Content-Type: application/json" \
  -d '{
    "site_id": "yoursite.com",
    "metrics": ["visitors", "pageviews"],
    "date_range": "30d",
    "dimensions": ["visit:source"]
  }'
The response is JSON with a results array. For dimensional queries, each element in the array is one dimension value with its associated metric values. The Plausible Stats API documentation covers the full set of available metrics, dimensions, and filter operators.
Umami: GET /api/websites/{websiteId}/stats
Umami’s API uses GET with query parameters. The key difference to be aware of: timestamps are in milliseconds, not seconds.
# Umami Cloud — use x-umami-api-key header
curl "https://api.umami.is/v1/websites/YOUR_WEBSITE_ID/stats" \
  -H "x-umami-api-key: YOUR_API_KEY" \
  -G \
  --data-urlencode "startAt=1717200000000" \
  --data-urlencode "endAt=1719791999000"

# Self-hosted — get token first, then query
TOKEN=$(curl -s -X POST https://your-umami.example.com/api/auth/login \
  -H "Content-Type: application/json" \
  -d '{"username": "admin", "password": "YOUR_PASSWORD"}' \
  | jq -r '.token')

curl "https://your-umami.example.com/api/websites/YOUR_WEBSITE_ID/stats" \
  -H "Authorization: Bearer $TOKEN" \
  -G \
  --data-urlencode "startAt=1717200000000" \
  --data-urlencode "endAt=1719791999000"
The stats endpoint returns pageviews, sessions, visitors, bounce rate, and average visit duration. For per-page breakdowns and event data, the Umami API documentation has the full endpoint reference.
Matomo: unified index.php endpoint
Matomo routes all API calls through a single endpoint with method parameters. Use POST to keep token_auth out of server logs.
# Visits summary — POST to keep token_auth out of logs
curl -X POST https://your-matomo.com/index.php \
  -d "module=API&method=VisitsSummary.get&idSite=1&period=day&date=today&format=JSON&token_auth=YOUR_TOKEN_AUTH"

# Top pages report
curl -X POST https://your-matomo.com/index.php \
  -d "module=API&method=Actions.getPageUrls&idSite=1&period=month&date=today&format=JSON&token_auth=YOUR_TOKEN_AUTH"
Find your token_auth in Matomo under Settings > Personal > Security > Auth Token. The Matomo Reporting API reference documents every available method — there are hundreds, covering essentially every report in the UI. For a structured walkthrough of the most useful methods, the guide to the Matomo Reporting API covers the patterns you’ll actually use day-to-day.
Common Endpoint Types Across Platforms
Regardless of which platform you’re using, analytics APIs cluster around a few core endpoint patterns.
Aggregate stats / query endpoints
The most common type. Specify a site, a date range, and a set of metrics; get back aggregated numbers. Plausible’s POST /api/v2/query, Matomo’s VisitsSummary.get, Umami’s /stats — all variations on this pattern.
Time-series endpoints
Instead of a single aggregated number for a period, you get data broken out by day or hour. Useful when you need trend lines rather than totals. Plausible supports this through the date_range with a dimensions of time:day; Umami has a separate pageviews time-series endpoint.
Real-time endpoints
Most “real-time” analytics APIs aren’t truly streaming — they’re polled. You hit a current-visitors or live endpoint every 30 to 60 seconds and display the latest snapshot. True streaming via WebSockets or Server-Sent Events is rare on the reporting side. The guide to real-time analytics APIs covers the polling vs streaming trade-offs in detail, including when each approach makes sense for your dashboard architecture.
Event capture endpoints
For writing data in rather than reading it out. If you’re building privacy-first integrations with Plausible or Umami and want to capture server-side events — purchases, form submissions, API calls — the capture endpoint is what you need. Matomo’s tracking API and PostHog’s event capture endpoint both support this flow.
Rate Limits, Sampling, and Real-World Constraints
The documentation makes analytics APIs look clean. Production use is messier. Here are the constraints you’ll actually hit.
Rate limits
Every hosted API has them. Plausible’s default is 600 requests per hour per API key. When you exceed it, you get a 429 Too Many Requests response. The right handling pattern is exponential backoff with jitter — wait, then retry with a longer wait if you hit another 429. Build this into any polling loop from the start; retrofitting it after hitting rate limits in production is painful.
Self-hosted platforms (Matomo, Umami, PostHog) give you more control — the rate limit is your own server capacity. That’s an advantage for high-frequency polling scenarios.
Data sampling
High-traffic properties on some platforms return sampled data in aggregate reports — the API processes a representative subset rather than every event. Responses usually include a flag indicating whether sampling was applied. Surface this in your UI if the accuracy of the number matters. Open-source self-hosted tools give you more control: on your own infrastructure with Matomo or Plausible, you query against unsampled data.
Data freshness and latency
Analytics data is rarely real-time even when the API endpoint is called “real-time.” Typical latencies run from a few seconds to several hours depending on the platform and report type. Build your integrations with this in mind — a zero-value response at midnight usually means data hasn’t been processed yet, not that your site had zero visitors.
Building a Real Integration: Nightly Stats to Postgres
Let’s make this practical. Here’s a minimal Python script that pulls yesterday’s stats from Plausible and upserts them into a Postgres table — the foundation of a simple data warehouse sync.
import os, requests, psycopg2
from datetime import date, timedelta

API_KEY = os.environ["PLAUSIBLE_API_KEY"]
SITE_ID = os.environ["PLAUSIBLE_SITE_ID"]
DB_URL  = os.environ["DATABASE_URL"]

yesterday = (date.today() - timedelta(days=1)).isoformat()

resp = requests.post(
    "https://plausible.io/api/v2/query",
    headers={"Authorization": f"Bearer {API_KEY}"},
    json={
        "site_id": SITE_ID,
        "metrics": ["visitors", "pageviews", "bounce_rate"],
        "date_range": yesterday,
    },
    timeout=15,
)
resp.raise_for_status()

results = resp.json()["results"]
# results[0]["metrics"] = [visitors, pageviews, bounce_rate]
visitors, pageviews, bounce_rate = results[0]["metrics"]

conn = psycopg2.connect(DB_URL)
with conn, conn.cursor() as cur:
    cur.execute(
        """
        INSERT INTO daily_stats (site_id, stat_date, visitors, pageviews, bounce_rate)
        VALUES (%s, %s, %s, %s, %s)
        ON CONFLICT (site_id, stat_date) DO UPDATE
          SET visitors = EXCLUDED.visitors,
              pageviews = EXCLUDED.pageviews,
              bounce_rate = EXCLUDED.bounce_rate;
        """,
        (SITE_ID, yesterday, visitors, pageviews, bounce_rate),
    )
conn.close()
Run this nightly via cron or a scheduled job. Add a 3-day lookback window (run for yesterday, two days ago, and three days ago with ON CONFLICT DO UPDATE) to catch late-arriving data that gets processed after your initial pull. That pattern handles about 99% of data freshness edge cases without any complex retry logic.
Frequently Asked Questions About Web Analytics APIs
What is a web analytics API?
A web analytics API is a programmatic interface that lets you query, export, or submit analytics data without using a platform’s UI. You make HTTP requests — typically to a REST endpoint — and receive structured data back in JSON format. Unlike a tracking script (which collects data in a browser), an analytics API operates server-to-server and is used for building custom dashboards, automating reports, and feeding data into pipelines.
What’s the difference between an analytics API and a tracking snippet?
A tracking snippet (like <script src="plausible.js">) is the collection layer: it runs in the visitor’s browser and sends events to the analytics platform. An analytics API is the query layer: it gives you programmatic access to the data the platform has already collected. They’re complementary, not interchangeable. You use the snippet to capture data; you use the API to retrieve and work with it. Some platforms also offer event capture APIs that let you submit events server-side, bypassing the browser snippet entirely — useful for server-side tracking scenarios.
How do analytics APIs handle authentication?
Most modern analytics APIs use one of three patterns. Bearer tokens (Plausible, PostHog) send a pre-generated key in the Authorization: Bearer header — the simplest and most secure pattern for server-side scripts. API key headers (Umami Cloud) use a custom header like x-umami-api-key — functionally similar. Query parameter tokens (Matomo’s token_auth) work but expose credentials in URLs and server logs if you use GET; always use POST with Matomo. OAuth 2.0 (GA4 Data API) is the most complex — required when accessing data on behalf of another user, but overkill for direct server-to-server integrations. The deeper guide on analytics API authentication covers all four patterns with concrete examples.
What are typical rate limits for web analytics APIs?
Plausible Cloud allows 600 requests per hour per API key. PostHog rate limits vary by plan. Matomo self-hosted is limited only by your server capacity, which you control entirely. Umami self-hosted similarly has no published limit — your server is the constraint. GA4 Data API uses a quota system that varies by property and report type, with daily limits on certain dimensions. For any hosted API, implement exponential backoff with jitter on 429 responses — it’s a one-time investment that saves considerable pain in production.
Which web analytics API should I use for my project?
Start with what you’re already using for analytics. If you’re on Plausible, its Stats API is the cleanest entry point — one endpoint, one header, JSON back, up and running in under an hour. If you need the richest open-source feature set (ecommerce tracking, goal conversions, dozens of report types, multiple output formats), Matomo’s API is the most powerful. For event-level product analytics and user behaviour queries beyond pageviews, PostHog’s HogQL endpoint is in a different category. GA4’s Data API is available if you’re locked into Google’s ecosystem, but carries meaningfully more setup overhead than the open-source options.
What to Build First
If you’ve never integrated an analytics API before, don’t start with a data warehouse pipeline. Start with a simple automated report.
Pick your platform. Generate an API key. Write a script that makes one API call, parses the response, and prints a formatted summary to the console. Run it. Then make it post to Slack or send an email on a schedule. That’s a working web analytics API integration, and it delivers value immediately.
From there, the path to custom dashboards, data pipelines, and multi-platform aggregation is incremental. Each step adds one layer of complexity. The fundamentals — auth headers, JSON parsing, rate limit handling, response validation — are the same across all of them.
In my experience, teams that build even a single working API integration change how they think about analytics data. It stops being something you check in a dashboard and becomes something you can compose, transform, and route wherever it’s useful. That shift is worth more than any specific feature the API exposes.
// Alicia Bennett
Lead Web Analyst based in Toronto with 12+ years in digital analytics — privacy-first tracking, open-source tools, and the analytics API layer that sits under every dashboard.
More about the author →