How to Build an SEO Reporting API Workflow
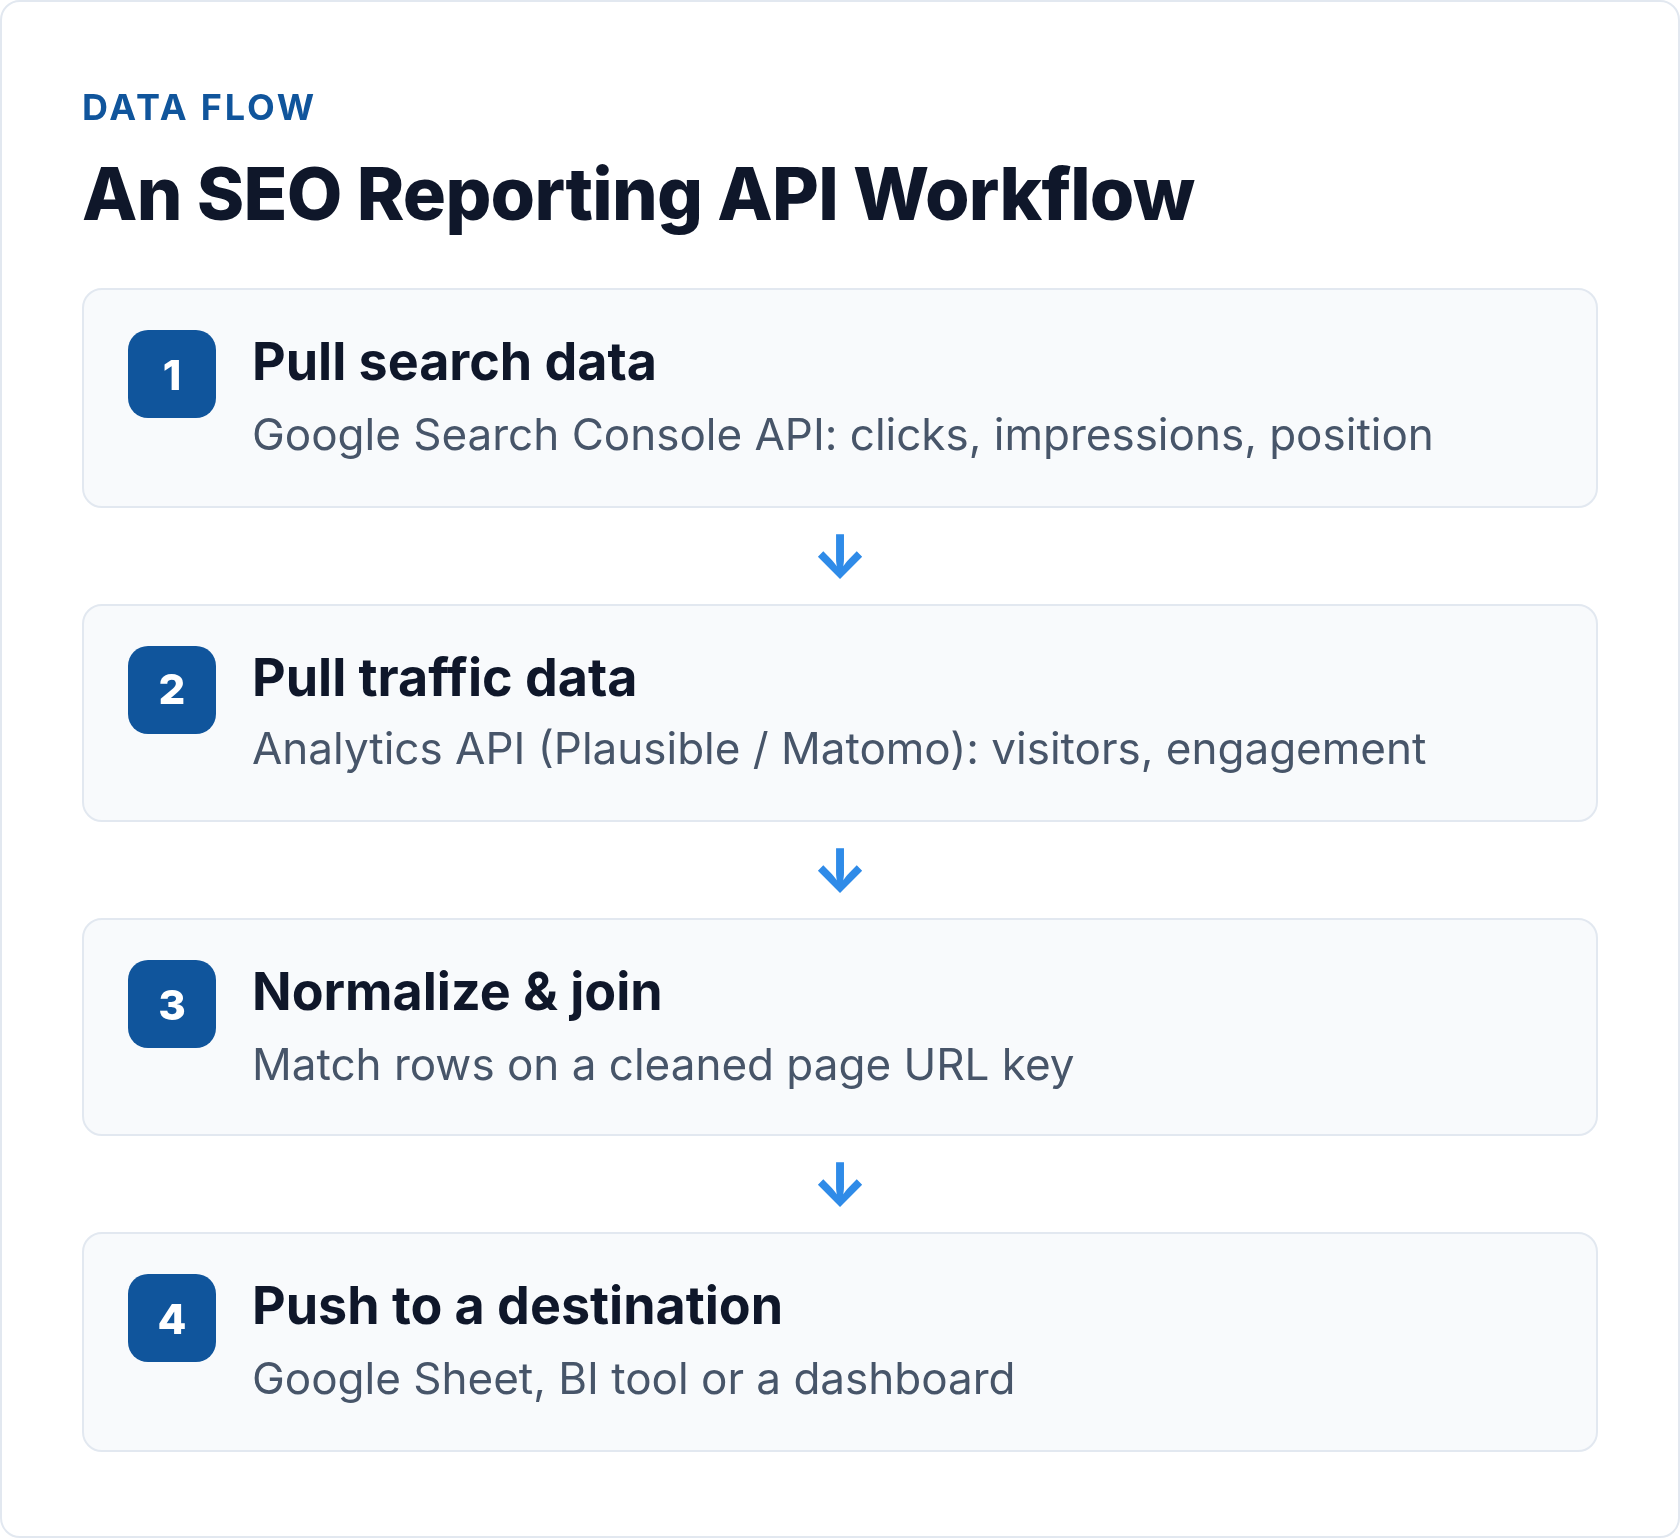
Most SEO teams are still copying data out of dashboards by hand. Search Console in one tab, your analytics platform in another, a spreadsheet somewhere in the middle — and a report that takes two hours every Monday morning. An automated SEO reporting API workflow pulls all of it without you touching a keyboard: authenticate once, schedule the pulls, join the datasets, and deliver a live report wherever stakeholders actually look.
This guide walks through building that workflow end to end — from service account setup through cron scheduling and final delivery to Google Sheets or Looker Studio. Every step includes working code. If you’re still deciding which SEO APIs to use in the first place, start with our SEO API guide, which compares the major options across accuracy, cost, and coverage. This article assumes you’ve made that choice and are ready to build.
What to Include in an SEO Report
Before writing a single line of code, agree on what the report needs to contain. I’ve seen pipelines rebuilt from scratch because nobody asked this question first. The metrics below cover the core of what a useful weekly or monthly SEO report should track:
| Metric | Source | Why It Matters |
|---|---|---|
| Clicks | Google Search Console | Actual visits from organic search |
| Impressions | Google Search Console | Visibility across all queries |
| Average position | Google Search Console | Rank signal by page or query |
| Click-through rate (CTR) | Google Search Console | Title/meta effectiveness |
| Sessions / visitors | Analytics API (Plausible, Matomo) | What happens after the click |
| Bounce rate / engagement | Analytics API | Content quality signal |
| Click-to-session ratio | Derived (GSC ÷ analytics) | Tracking integrity check |
| Top queries per page | Google Search Console | Content relevance and gaps |
| Core Web Vitals (optional) | PageSpeed Insights API | Ranking factor, not just UX |
The shape of this output determines which fields you’ll request at each API. Decide what belongs in the report before you design the schema — not after.
Prerequisites
You’ll need three things before writing any code:
- A Google Search Console property with verified ownership, or a service account with delegated access
- An analytics platform that exposes a reporting API — Plausible, Matomo, or another privacy-first tool (see our guide to web analytics APIs for a rundown of what each exposes)
- A destination for the report: Google Sheets, a Postgres table, Looker Studio, or a BI tool like Metabase
For Python dependencies: google-auth, google-api-python-client, requests, pandas, and gspread cover everything in this guide.
Step 1: Authenticate with the Google Search Console API
The Google Search Console API uses OAuth 2.0. For an automated, unattended workflow the right choice is a service account — you generate a JSON key file, grant that account read access to your GSC property, and every subsequent run authenticates without any human in the loop.
In the Google Cloud Console: create a service account under your project, download the JSON credentials file, then in Search Console go to Settings → Users and permissions and add the service account email as a restricted user.
from google.oauth2 import service_account
from googleapiclient.discovery import build

SCOPES = ['https://www.googleapis.com/auth/webmasters.readonly']

credentials = service_account.Credentials.from_service_account_file(
    '/path/to/service-account.json',
    scopes=SCOPES
)
gsc = build('searchconsole', 'v1', credentials=credentials)
Keep the JSON key file out of version control. Store it as an environment variable or in a secrets manager. Service account credentials are effectively permanent until explicitly rotated — treat them accordingly.
Step 2: Pull Search Performance Data
The core endpoint is searchanalytics.query. POST a JSON body with your property URL, date range, dimensions, and row limit. This request fetches the last 28 days of clicks, impressions, CTR, and position broken down by page and query:
response = gsc.searchanalytics().query(
    siteUrl='https://yoursite.com/',
    body={
        'startDate': '2026-05-16',
        'endDate':   '2026-06-12',
        'dimensions': ['page', 'query'],
        'rowLimit': 25000,
        'dataState': 'final'
    }
).execute()

rows = response.get('rows', [])
# Each row: { keys: [page, query], clicks, impressions, ctr, position }
for row in rows:
    page, query = row['keys']
    print(page, query, row['clicks'], row['position'])
A few things worth knowing: the GSC API lags 2–3 days behind real time, so set your end date accordingly. The default row limit is 1,000; 25,000 is the maximum per request. For larger properties you’ll need to paginate using startRow. Use 'dataState': 'final' to avoid preliminary numbers that will shift later.
Step 3: Pull Traffic Data from Your Analytics API
Search Console tells you about impressions and clicks from Google. It doesn’t tell you what happens after the click. For that, you need your analytics platform’s API.
Plausible Stats API
The Plausible Stats API uses a Bearer token. Generate a key from your Plausible account settings, then POST to /api/v2/query:
curl -X POST https://plausible.io/api/v2/query \
  -H "Authorization: Bearer YOUR_API_KEY" \
  -H "Content-Type: application/json" \
  -d '{
    "site_id": "yoursite.com",
    "metrics": ["visitors", "pageviews", "bounce_rate", "visit_duration"],
    "date_range": ["2026-05-16", "2026-06-12"],
    "dimensions": ["event:page"],
    "filters": [["is", "visit:source", ["Google"]]]
  }'
The filter on visit:source scopes results to organic search traffic, so when you join this data with GSC you’re comparing the same users. Plausible enforces a rate limit of 600 requests per hour — more than enough for a daily scheduled job.
Matomo Reporting API
Matomo uses a token_auth parameter. For self-hosted instances, every request hits index.php. Use POST rather than GET — with GET, the token appears in server access logs.
curl -X POST https://your-matomo-instance.com/index.php \
  --data-urlencode "module=API" \
  --data-urlencode "method=Actions.getPageUrls" \
  --data-urlencode "idSite=1" \
  --data-urlencode "period=range" \
  --data-urlencode "date=2026-05-16,2026-06-12" \
  --data-urlencode "segment=referrerType==search" \
  --data-urlencode "format=JSON" \
  --data-urlencode "token_auth=YOUR_TOKEN_AUTH"
The segment=referrerType==search filter isolates organic search sessions, mirroring Plausible’s source filter. Matomo’s API is unusually flexible — almost every report visible in the UI has a corresponding API method you can call programmatically.
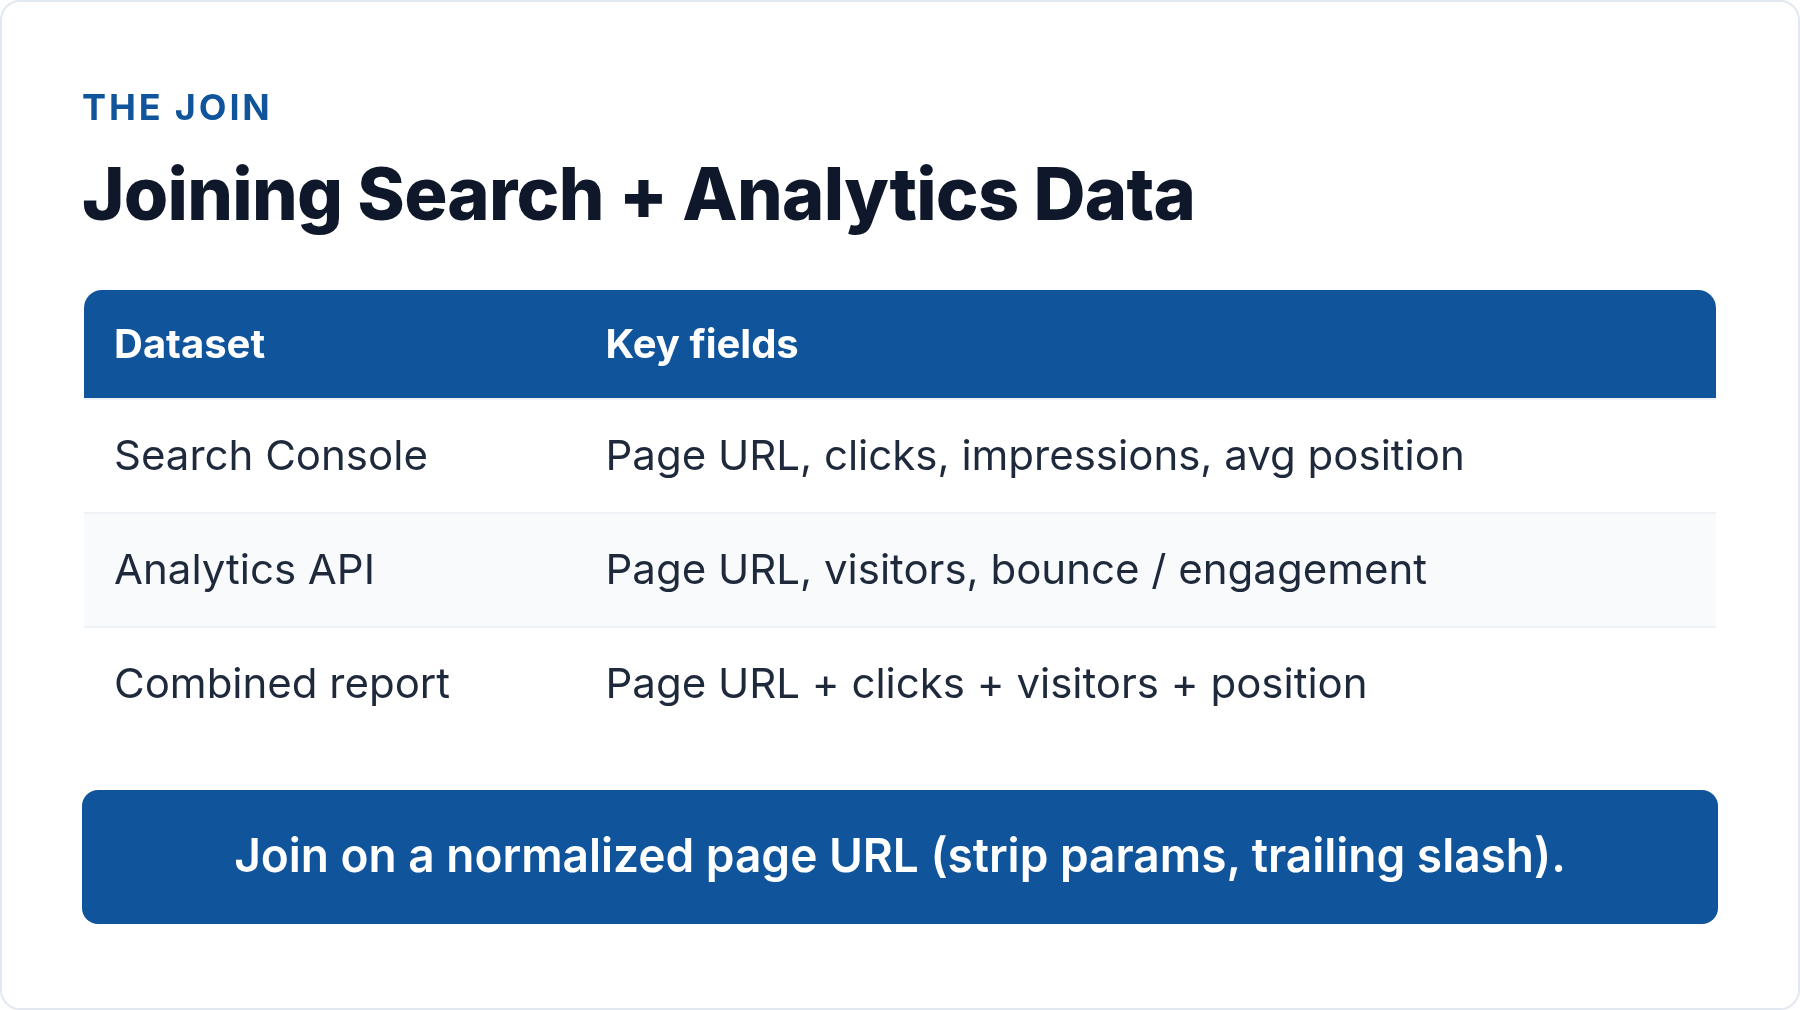
Step 4: Join the Datasets
You now have two tables: GSC (page + query → clicks, impressions, position) and analytics (page → sessions, bounce rate). The join key is the page URL, but trailing slash mismatches and protocol differences (http vs https) will silently drop rows. Normalize before joining.
import pandas as pd

# gsc_df columns: page, query, clicks, impressions, ctr, position
# analytics_df columns: page, visitors, bounce_rate

# Normalize URLs
gsc_df['page'] = gsc_df['page'].str.rstrip('/').str.lower()
analytics_df['page'] = analytics_df['page'].str.rstrip('/').str.lower()

# Aggregate GSC to page level (drop query dimension)
gsc_pages = gsc_df.groupby('page').agg(
    clicks=('clicks', 'sum'),
    impressions=('impressions', 'sum'),
    avg_position=('position', 'mean')
).reset_index()

# Join on page URL
combined = gsc_pages.merge(analytics_df, on='page', how='left')
The left join keeps all GSC pages even when analytics has no matching record — useful for flagging pages that receive clicks but record no measurable traffic (possible tracking gaps or redirect issues).
Compute a click-to-session ratio immediately after joining. If GSC reports 500 clicks to a page but analytics records 100 sessions, something is wrong — broken tracking, a redirect loop, or a bot filter discrepancy. Catching this in the join step saves you from presenting bad numbers to stakeholders. The broader question of why GSC and analytics numbers diverge is worth understanding; our article on semantic SEO analytics and user intent goes deeper into how to interpret engagement signals alongside search data.
Step 5: Handle Rate Limits and Errors Gracefully
Automated workflows break silently more often than they fail loudly. Rate limits are the most common cause. Both GSC and analytics APIs return 429 Too Many Requests when you exceed quota. The correct response is exponential backoff — wait, then retry with an increasing delay.
import time

def api_call_with_backoff(fn, max_retries=5):
    for attempt in range(max_retries):
        try:
            return fn()
        except Exception as e:
            if '429' in str(e) or 'rate' in str(e).lower():
                wait = 2 ** attempt  # 1, 2, 4, 8, 16 seconds
                print(f"Rate limited. Waiting {wait}s...")
                time.sleep(wait)
            else:
                raise
    raise RuntimeError("Max retries exceeded")
Beyond rate limits: always validate the shape of the response before processing it. Check that expected keys exist, handle empty rows arrays (a valid response for a date range with no data), and log unexpected status codes to a file rather than letting them crash silently. I’ve seen dozens of SEO reporting pipelines that looked fine in testing and fell apart on the first Monday morning run because nobody handled the edge cases.
Step 6: Schedule the Workflow
A report that runs once is a script. A report that runs every day without you touching it is a workflow. On Linux, cron is the standard scheduler. A cron entry that runs your SEO report script every day at 6 AM:
# crontab -e
0 6 * * * /usr/bin/python3 /opt/seo-report/run.py >> /var/log/seo-report.log 2>&1
Scheduling rules I always follow:
- Run data pulls during off-peak hours — not just to avoid rate limits, but because APIs like GSC can be slower during business hours
- Log both stdout and stderr (
>> logfile 2>&1) so you can debug failures after the fact - Send a failure notification — silence is not a success signal; a missed report often goes unnoticed for weeks
- Use a lock file or process check to prevent overlapping runs if the previous job is still running
For a more robust setup without managing a server, GitHub Actions scheduled workflows provide built-in logging, retry handling, and email notifications. Cloud equivalents include AWS EventBridge Scheduler and Google Cloud Scheduler.
This is also a natural place to integrate Core Web Vitals data — the PageSpeed Insights API runs unattended and can be called on the same schedule. The full approach is covered in our Core Web Vitals measurement guide, which includes a pattern for pulling CWV scores programmatically and folding them into a combined report.
Step 7: Deliver the Report
Data sitting in a database helps nobody. Get it in front of the people who need it.
Google Sheets
The lowest-friction destination. Use the gspread library with the same service account you used for GSC:
import gspread
from google.oauth2 import service_account

creds = service_account.Credentials.from_service_account_file(
    '/path/to/service-account.json',
    scopes=[
        'https://www.googleapis.com/auth/spreadsheets',
        'https://www.googleapis.com/auth/drive'
    ]
)
gc = gspread.authorize(creds)
sheet = gc.open("SEO Weekly Report").worksheet("Data")

sheet.clear()
sheet.append_row(combined.columns.tolist())
sheet.append_rows(combined.values.tolist())
Always include a report_date column so it’s clear when the data was last refreshed.
Looker Studio
If your team already uses Looker Studio, the cleanest approach is writing your combined dataset to a Google Sheet (as above) and connecting Looker Studio to that sheet as a data source. Looker Studio updates automatically when the sheet refreshes — no additional code needed, and stakeholders get interactive charts without maintaining a BI server.
For teams with more complex needs, writing to a Postgres table and connecting Looker Studio via its Community Connector or BigQuery connector gives you query-level control over what the dashboard sees.
Email Summary
For stakeholders who don’t open dashboards, a brief HTML email with the week’s top movers is often more effective than the most polished dashboard. Python’s smtplib handles this — format your top five pages by traffic change as an HTML table, send to user [at] example.com, done. Build the email step as a separate function that the same cron job calls after the sheet write completes.
The broader patterns for building reliable automated reporting pipelines — including how to structure multi-source data flows and handle schema drift — are covered in our guide to automated reporting workflows.
Key Endpoints at a Glance
| Source | Endpoint | Auth Method | Key Parameters |
|---|---|---|---|
| Google Search Console | POST /v1/sites/{site}/searchAnalytics/query |
OAuth 2.0 / Service Account | startDate, endDate, dimensions, rowLimit |
| Plausible | POST /api/v2/query |
Bearer token (header) | site_id, metrics, date_range, dimensions, filters |
| Matomo | POST /index.php |
token_auth parameter |
module=API, method, idSite, period, segment |
| PageSpeed Insights | GET /pagespeedonline/v5/runPagespeed |
API key (query param) | url, strategy, key |
| Google Sheets | Sheets API v4 | OAuth 2.0 / Service Account | spreadsheetId, range, valueInputOption |
Putting It All Together
A complete SEO reporting API workflow in practice: a cron job fires at 6 AM, authenticates with a service account, pulls 28 days of GSC data for your top pages, pulls matching traffic and engagement data from Plausible or Matomo, normalizes and joins the two datasets, computes derived metrics (click-to-session ratio, average position per page, traffic trend week-over-week), and writes the result to a Google Sheet your team has bookmarked. Total runtime: under three minutes for most sites.
The setup takes a few hours the first time. After that, it runs itself. Start with a single data source — GSC alone is already more useful than most manual SEO reports — then layer in analytics data once that first pull is stable. Incremental is better than a big-bang build that breaks before anyone sees it.
One thing I always tell the teams I work with: the hardest part of building this workflow isn’t the code. It’s agreeing on which metrics matter before the first query runs. That conversation is worth having first.
// Alicia Bennett
Lead Web Analyst based in Toronto with 12+ years in digital analytics — privacy-first tracking, open-source tools, and the analytics API layer that sits under every dashboard.
More about the author →