What Is Looker Studio (And Why Use It)?
Looker Studio (formerly Google Data Studio) is Google’s free dashboard and reporting tool. It connects to your data sources — Google Analytics, Google Ads, spreadsheets, databases — and turns raw numbers into visual reports that actually make sense.
Why it matters for analytics practitioners:
- It’s free — No per-user fees, no feature limits
- Real-time data — Dashboards update automatically
- Shareable — Send links instead of PDF attachments
- Customizable — Build exactly what stakeholders need to see
This guide walks you through creating your first dashboard, from connecting data to sharing with your team.
Getting Started: Your First Dashboard
Step 1: Access Looker Studio
Go to lookerstudio.google.com and sign in with your Google account. You’ll see the home screen with templates and recent reports.
Click Blank Report to start fresh, or choose a template to modify.
Step 2: Connect Your Data Source
Looker Studio needs data to visualize. The most common sources:
- Google Analytics 4 — Website traffic and behavior (or consider GA alternatives)
- Google Search Console — SEO performance (combine with Core Web Vitals tracking)
- Google Ads — Campaign metrics
- Google Sheets — Custom data, exports, manual tracking
- BigQuery — Large datasets, data warehouse
To connect GA4:
- Click Add data in the toolbar
- Select Google Analytics
- Choose your account → Property → Click Add
- Accept the connection
Your GA4 dimensions and metrics are now available for charts.
Step 3: Add Your First Chart
With data connected, let’s visualize something useful:
- Click Add a chart in the toolbar
- Select Time series (line chart)
- Draw the chart on your canvas
- In the right panel, set:
- Dimension: Date
- Metric: Sessions
You now have a sessions-over-time chart. Drag the corners to resize, or drag the chart to reposition.
Essential Dashboard Components
Scorecards: Key Metrics at a Glance
Scorecards show single numbers — perfect for KPIs at the top of your dashboard.
Create a row of scorecards showing:
- Total Sessions (see our guide on key website metrics)
- Total Users
- Bounce Rate (or Engagement Rate in GA4)
- Average Session Duration
- Conversions (if tracking goals)
Pro tip: Add comparison to previous period. Select your scorecard → Setup panel → Enable Comparison date range. Now stakeholders see if metrics are up or down.
Tables: Detailed Breakdowns
Tables work well for:
- Top pages by pageviews
- Traffic sources breakdown
- Campaign performance
- Geographic data
Add a table showing top landing pages:
- Add a chart → Table
- Dimension: Landing page
- Metrics: Sessions, Bounce rate, Conversions
- Sort by Sessions descending
Pie Charts and Bar Charts: Proportions
Use pie charts sparingly — they work for showing proportions when you have 2-5 categories:
- Device category (Desktop/Mobile/Tablet)
- New vs. returning users
- Traffic source breakdown
Bar charts work better when you have more categories or want to compare values directly.
Geo Maps: Geographic Data
If location matters for your business, add a geo map:
- Add a chart → Google Maps (or Geo chart)
- Dimension: Country (or City, Region)
- Metric: Sessions
The map colors regions by traffic volume. Useful for identifying strong/weak markets.
Making Dashboards Interactive
Date Range Control
Let viewers choose their own date range:
- Add a control → Date range control
- Position it at the top of your dashboard
- Set a sensible default (Last 30 days works for most)
All charts connected to the same data source will update when the date changes.
Filter Controls
Add dropdowns to filter data dynamically:
- Device filter — Let viewers focus on mobile or desktop
- Country filter — Isolate specific markets
- Campaign filter — Focus on specific initiatives
To add:
- Add a control → Drop-down list
- Set the Control field to your filter dimension (e.g., Device category)
- Position near your date control
Pages for Different Views
Complex dashboards benefit from multiple pages:
- Page 1: Executive Summary — High-level KPIs
- Page 2: Traffic Analysis — Sources, channels, campaigns
- Page 3: Content Performance — Top pages, engagement
- Page 4: Conversions — Goals, funnels, revenue
Add pages via Page → New page in the menu. Create navigation by adding text links or using the built-in page navigation control.
Design Tips for Professional Dashboards
Layout Principles
Follow the inverted pyramid:
- Top: Most important metrics (scorecards)
- Middle: Key trends and breakdowns
- Bottom: Detailed tables and secondary info
Use consistent spacing: Align charts to a grid. Enable View → Snap to grid for easier alignment.
Group related items: Use rectangles or background colors to visually group related charts.
Color Usage
- Limit your palette — 2-3 colors maximum
- Use brand colors — Match your company’s visual identity
- Reserve red/green — Use for positive/negative indicators only
- Gray for secondary — Less important elements in muted tones
Set consistent colors via Theme and layout in the toolbar. Define your palette once, apply everywhere.
Typography
- Headers: 18-24px, bold
- Chart titles: 14-16px
- Data labels: 10-12px
- Keep it readable: Avoid fonts smaller than 10px
Connecting Multiple Data Sources
Blending Data
Sometimes you need to combine data from different sources. For example:
- GA4 sessions + Google Ads spend = Cost per session
- Search Console clicks + GA4 conversions = SEO conversion rate
To blend data:
- Select a chart
- In Setup, click Blend data
- Add your second data source
- Define the join key (common dimension, usually Date)
- Select metrics from both sources
Caution: Data blending has limitations. For complex joins, consider preparing data in Google Sheets or BigQuery first.
Google Sheets as a Data Source
Sheets integration is powerful for:
- Budget tracking — Manual budget data alongside actual spend
- Targets/goals — Show progress against targets
- Offline data — CRM exports, sales data, anything not in Google’s ecosystem
- Custom calculations — Prepare complex metrics in Sheets
Keep your Sheet structure consistent — don’t move columns around or the connection breaks.
Automating Your Reports
Scheduled Email Delivery
Send reports automatically:
- Open your report
- Share → Schedule email delivery
- Set recipients, frequency (daily/weekly/monthly), and time
- Choose PDF attachment or link to live report
Recipients get the report in their inbox without logging into Looker Studio.
Embedded Reports
Embed dashboards in other tools:
- File → Embed report
- Copy the embed code
- Paste into your intranet, wiki, or internal portal
Viewers need Google account access, so this works best for internal use.
Common Mistakes to Avoid
Too many metrics: A dashboard showing 50 numbers helps no one. Focus on 5-10 key metrics that drive decisions.
No context: Numbers without comparison are meaningless. Always show vs. previous period or vs. target.
Ignoring mobile: Check how your dashboard looks on phones. Many stakeholders check reports on mobile.
Stale data: If using Sheets, make sure the data updates. Nothing worse than decisions based on last month’s numbers.
No clear story: Dashboards should answer questions. “How are we doing?” “What’s working?” “Where should we focus?” If your dashboard doesn’t answer these, redesign it.
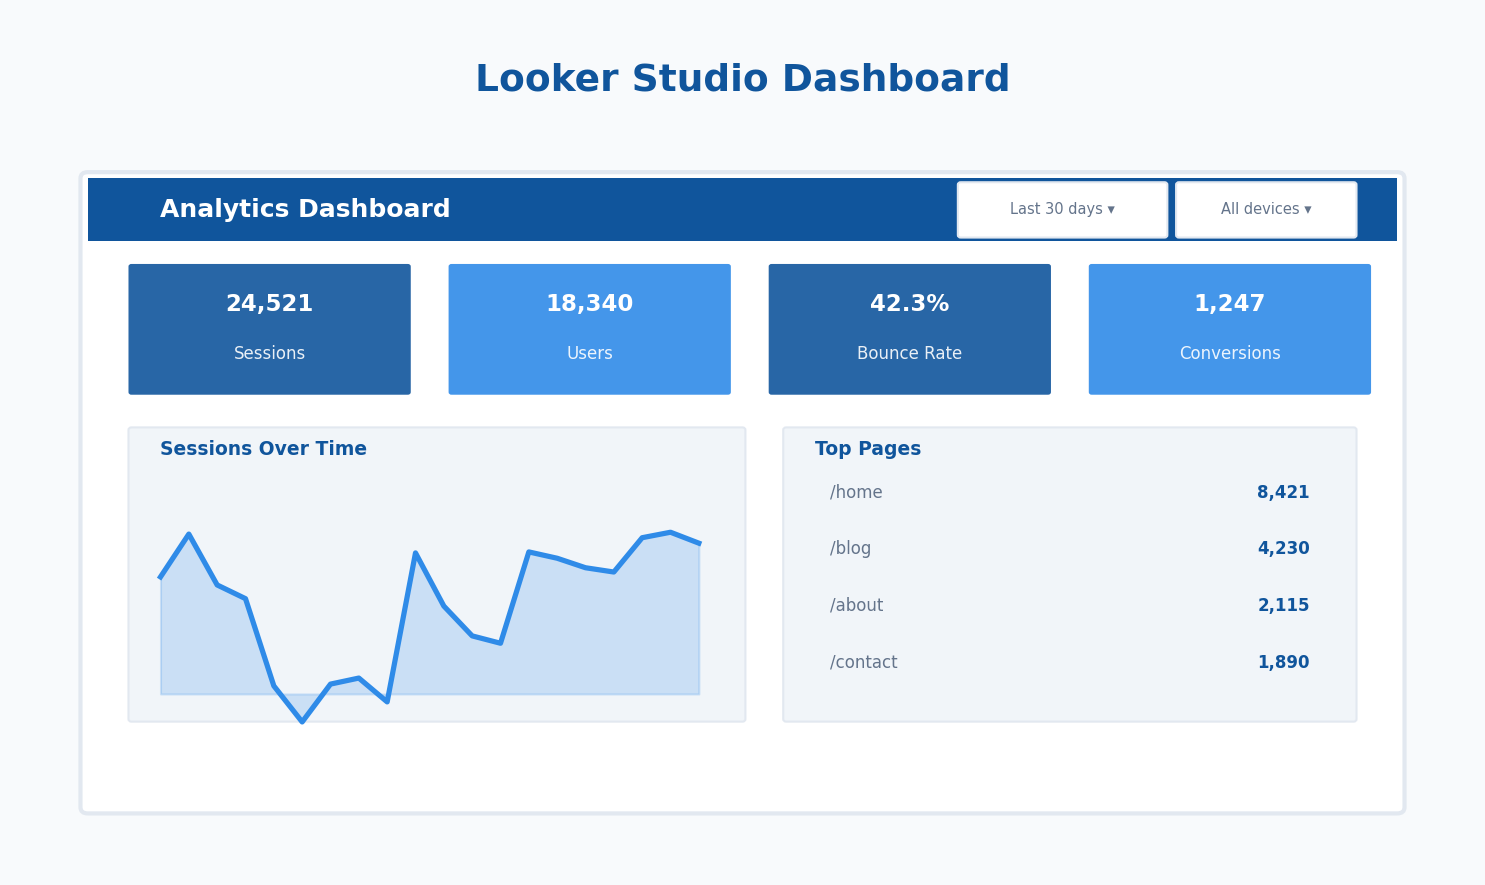
Dashboard Template: Website Performance
Here’s a practical template structure for a general website performance dashboard:
Row 1 — Date control + filters:
- Date range selector
- Device filter
- Country filter (if relevant)
Row 2 — KPI scorecards (with comparison):
- Sessions
- Users
- Pageviews
- Avg. session duration
- Conversions
Row 3 — Trend charts:
- Sessions over time (line chart)
- Users by device (pie chart)
Row 4 — Traffic breakdown:
- Sessions by channel (bar chart)
- Top traffic sources (table)
Row 5 — Content performance:
- Top landing pages (table with sessions, bounce rate, conversions)
This template works for most websites. Customize based on what matters for your business.
Next Steps
You’ve got the foundation. Here’s how to level up:
- Explore calculated fields — Create custom metrics and dimensions using formulas
- Try community connectors — Connect to Facebook Ads, HubSpot, Salesforce, and 500+ other platforms
- Build templates — Create reusable report templates for different clients or projects
- Learn BigQuery — For advanced analysis, connect Looker Studio to your data warehouse
The best dashboard is one people actually use. Start simple, get feedback, iterate. A basic dashboard that gets checked daily beats a fancy one that’s ignored.