
Your best-performing blog post from 2024 is quietly losing rankings. It’s dropped from position 3 to position 9, traffic is down 40%, and you haven’t noticed because nothing broke — it just faded. This is content decay, and it’s one of the biggest missed opportunities in SEO.
I’ve watched clients lose thousands of monthly visits to content decay before anyone flagged it. The good news: content decay detection is straightforward once you set up the right monitoring. In this guide, I’ll show you exactly how to find decaying pages, diagnose why they’re declining, and fix them before the traffic disappears completely.
What Is Content Decay and Why Does It Happen?
Content decay is the gradual decline of a page’s organic traffic and search rankings over time. It’s not a penalty or a technical failure — it’s the natural result of content becoming less relevant relative to the competition.
The most common causes:
- Fresher competitors: Someone published a more up-to-date article targeting the same keyword
- Search intent shifts: What users want when they search the term has changed. Understanding semantic SEO and user intent helps you stay ahead of these shifts.
- Outdated information: Statistics, tool recommendations, or processes that are no longer current
- SERP feature changes: Google added a featured snippet, People Also Ask box, or AI overview that pushes organic results down
- Technical degradation: Page speed has slowed, Core Web Vitals have worsened, or mobile experience has regressed
- Internal competition: You’ve published newer content that cannibalizes the original page
Content decay isn’t a failure — it’s a predictable lifecycle. The failure is not having a system to detect and respond to it.
Step 1: Pull Your Traffic Data
You need at least 6 months of historical data to reliably detect decay. Twelve months is better because it accounts for seasonal patterns.
Using Google Search Console
Search Console is your primary data source for organic performance. Navigate to Performance > Search Results, set your date range to the last 12 months, and export the Pages tab.
For a more granular view, use the Search Console API to pull monthly data programmatically:
# Python: Pull monthly Search Console data per page
from google.oauth2 import service_account
from googleapiclient.discovery import build
import datetime

def get_monthly_page_data(property_url, start_date, end_date):
    credentials = service_account.Credentials.from_service_account_file(
        'credentials.json',
        scopes=['https://www.googleapis.com/auth/webmasters.readonly']
    )
    service = build('searchconsole', 'v1', credentials=credentials)

    response = service.searchanalytics().query(
        siteUrl=property_url,
        body={
            'startDate': start_date,
            'endDate': end_date,
            'dimensions': ['page', 'date'],
            'rowLimit': 25000,
            'dimensionFilterGroups': [{
                'filters': [{
                    'dimension': 'country',
                    'operator': 'equals',
                    'expression': 'usa'
                }]
            }]
        }
    ).execute()

    return response.get('rows', [])
Using Your Analytics Platform
Complement Search Console data with your analytics platform. Search Console tells you about impressions and clicks from search; your analytics tells you what happens after the click — bounce rate, time on page, and conversions.
Export landing page reports for organic traffic, broken down by month. You want to see both the traffic trajectory and the engagement trend.
Step 2: Identify Decaying Pages
With your data exported, you need a systematic method to flag pages that are declining. Here’s the framework I use with every client.
The Comparison Method
Compare the most recent 3-month period against the same period one year ago (to account for seasonality). Flag any page where:
- Organic clicks dropped 20%+ year-over-year
- Average position declined by 3+ spots
- Impressions dropped 25%+ (indicating a ranking loss, not just CTR change)
In a spreadsheet, the formula looks like this:
// Google Sheets formula for decay detection
// Column A: Page URL
// Column B: Clicks (recent 3 months)
// Column C: Clicks (same period last year)
// Column D: Decay flag

=IF(AND(C2>0, (B2-C2)/C2 < -0.2), "DECAYING", "STABLE")
The Trend Method
For pages without year-over-year data, compare rolling 3-month averages. If each successive 3-month window shows declining traffic, the page is decaying regardless of how much it’s dropped in absolute terms.
This catches slow declines that the comparison method might miss — a page losing 5% per month doesn’t trigger a 20% YoY threshold for months, but the trend is clear.
Prioritization Matrix
Not every decaying page deserves attention. Prioritize based on the potential value of recovering that traffic:
| Priority | Criteria | Action |
|---|---|---|
| Critical | High traffic page (500+ monthly clicks) with 30%+ decline | Refresh immediately |
| High | Conversion-driving page with any measurable decline | Refresh within 2 weeks |
| Medium | Moderate traffic (100-500 clicks) with 20%+ decline | Schedule for next content sprint |
| Low | Low traffic page (<100 clicks) with decline | Batch refresh quarterly |
Step 3: Diagnose the Cause
Knowing a page is decaying isn’t enough — you need to understand why before you can fix it. Different causes require different remedies.
SERP Analysis
Search the primary keyword for each decaying page and examine what’s changed:
- Who’s outranking you now? Open the top 3 results. Are they more recent, more comprehensive, or better structured?
- Has search intent shifted? If your “how-to” article is being outranked by product pages, Google has reclassified the intent.
- Are there new SERP features? A featured snippet, knowledge panel, or AI overview may be absorbing clicks that used to go to organic results.
Content Audit Checklist
For each decaying page, check:
- Freshness signals: When was it last updated? Does it reference outdated years, tools, or statistics?
- Comprehensiveness: Do competing pages cover subtopics that yours doesn’t?
- User engagement: Has time on page declined? Are users bouncing faster than before?
- Technical health: Has page speed degraded? Are there new broken links or images?
- Internal linking: Is the page still well-linked from other content, or has it become orphaned as your site grew?
Competitive Gap Analysis
Compare your content against the pages that now outrank you. Build a simple comparison:
| Factor | Your Page | Top Competitor |
|---|---|---|
| Word count | 1,200 | 2,800 |
| Last updated | March 2024 | January 2026 |
| Subtopics covered | 5 | 9 |
| Images/diagrams | 1 | 6 |
| Structured data | No | FAQ + HowTo schema |
| Page speed (mobile) | 3.2s | 1.8s |
This table tells you exactly where to invest your refresh effort. Don’t guess — measure.
Step 4: Refresh Decaying Content
Content refreshes aren’t about rewriting everything. They’re about targeted improvements that address the specific reasons a page is losing ground.
Quick Wins (30 Minutes or Less)
- Update the publication date and any outdated statistics or references
- Fix broken links and replace them with current sources
- Add a structured data markup (FAQ schema, HowTo schema) if competitors have it and you don’t
- Improve the meta title and description to boost CTR
- Add or update internal links to newer related content
Medium Effort (1-3 Hours)
- Add new sections covering subtopics that competitors address
- Replace outdated screenshots and create new diagrams
- Improve page speed by optimizing images and reducing render-blocking resources
- Add a summary table or comparison chart that could earn a featured snippet
- Rewrite the introduction to better match current search intent
Major Refresh (Half Day+)
- Significantly expand the content with new research or original data
- Restructure the article to better match how competitors organize their content
- Create custom visuals, original studies, or expert quotes that add unique value
- Merge with related thin content to create a more authoritative resource
Match your effort to the priority level from Step 2. A critical page with high traffic deserves a major refresh. A low-traffic page gets the quick wins.
Step 5: Build Ongoing Monitoring
Detecting content decay once is useful. Detecting it automatically every month is a system. Here’s how to set up ongoing monitoring so decaying pages never slip through the cracks again.
Monthly Automated Report
Create a scheduled report that flags pages meeting your decay criteria. A simple Google Sheets setup with monthly Search Console data exports works for most sites. Compare each page’s current 3-month average against its peak 3-month average — any page that’s dropped more than 20% from its peak gets flagged.
// Decay monitoring formula
// Column B: Peak 3-month average clicks
// Column C: Current 3-month average clicks
// Column D: Decline percentage
// Column E: Needs attention flag

=IF((B2-C2)/B2 > 0.2, "REVIEW", "OK")
Alert Thresholds
Set up alerts at different levels based on the severity of the decline:
| Decline from Peak | Alert Level | Action |
|---|---|---|
| 20-30% | Watch | Add to next month’s review queue |
| 30-50% | Warning | Diagnose cause, schedule refresh |
| 50%+ | Critical | Immediate diagnosis and action |
Content Lifecycle Calendar
Beyond reactive monitoring, build a proactive refresh calendar. Some content types decay predictably:
- “Best of [Year]” posts: Refresh annually before the new year
- Statistics roundups: Update quarterly as new data becomes available
- Tool guides: Review every 6 months as features change
- Evergreen how-to content: Audit annually, refresh if competitors have updated
I keep a simple spreadsheet with every published article, its primary keyword, peak traffic month, and scheduled review date. When a page hits its review date, I check its performance before deciding whether it needs work. According to Google’s helpful content guidelines, regularly maintaining and updating content is a signal of quality that benefits your entire site.
Measuring the Impact of Content Refreshes
Track every refresh to build evidence for future investment. After updating a page, monitor these metrics over the following 4-8 weeks:
- Average position: Did rankings recover? How far?
- Organic clicks: Has traffic returned to (or exceeded) previous levels?
- Impressions: Are you appearing for the same keywords, or have you picked up new ones?
- CTR: If you updated the meta title/description, has click-through rate improved?
- Engagement: Time on page, scroll depth, and conversion rate post-refresh
In my experience, a well-executed refresh typically recovers 60-80% of lost traffic within 6-8 weeks. Some pages exceed their previous peak, especially if the refresh added significant new value. Pages that don’t respond within 8 weeks usually have a deeper issue — typically keyword cannibalization or a fundamental intent mismatch that a content refresh alone won’t fix.
Content decay isn’t optional — every page you publish will eventually decline. The difference between sites that maintain their organic traffic and sites that watch it erode is simply this: a system for catching and fixing decay before it compounds. Build the monitoring, schedule the reviews, and treat content refreshes as a core part of your SEO workflow — not an afterthought.
Written by Alicia Bennett
Lead Web Analyst based in Toronto with 12+ years in digital analytics. Specializing in privacy-first tracking, open-source tools, and making data meaningful.
More about Alicia →Related Articles
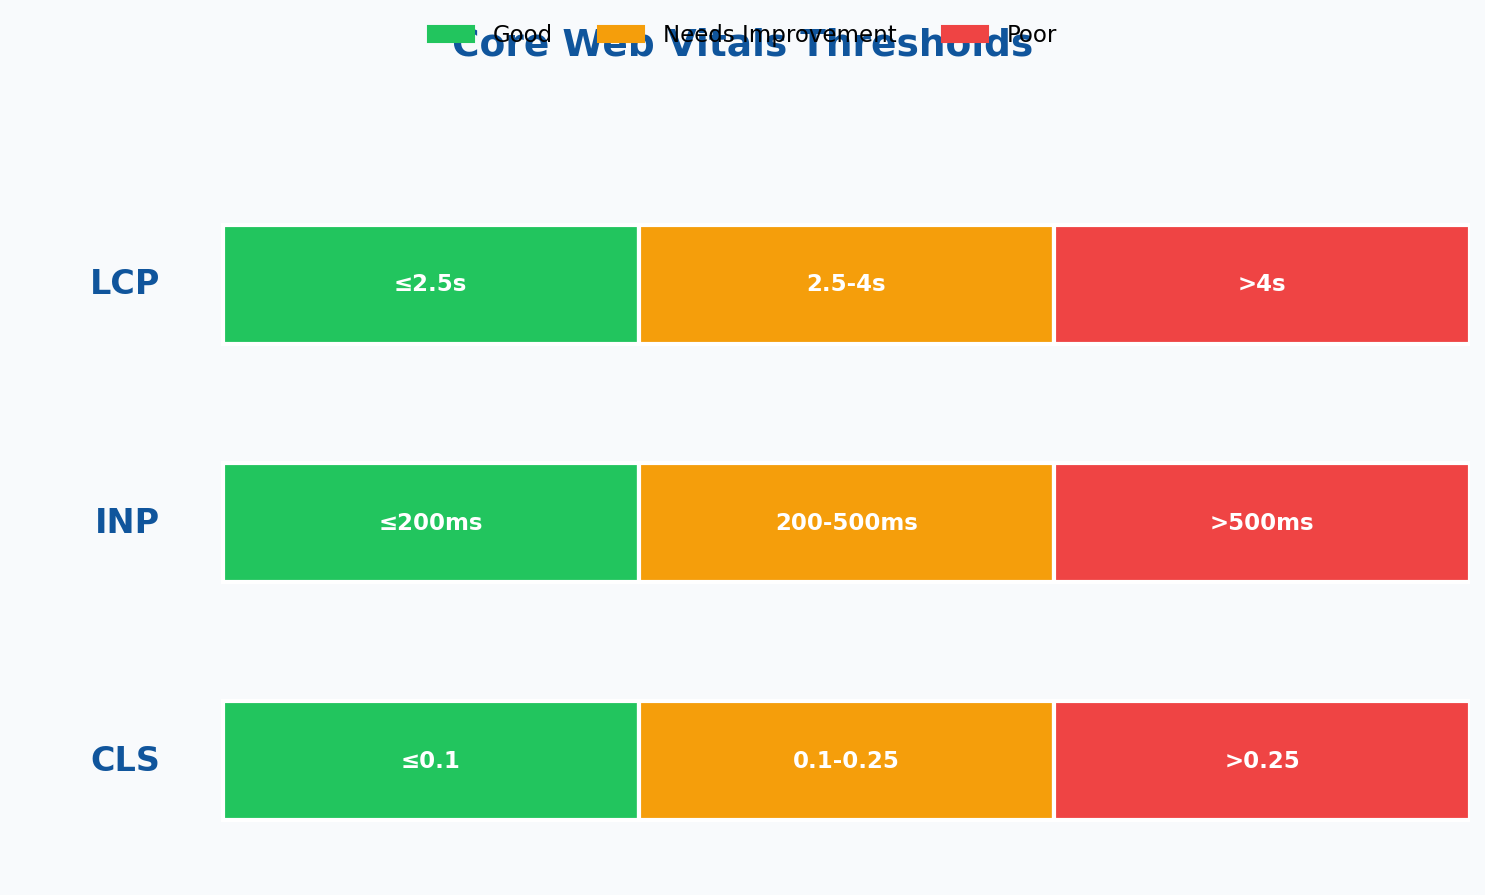
Core Web Vitals: How to Measure and Improve Your SEO Performance
What Are Core Web Vitals (And Why Should You Care)? Core Web Vitals are Google’s way of measuring how users…
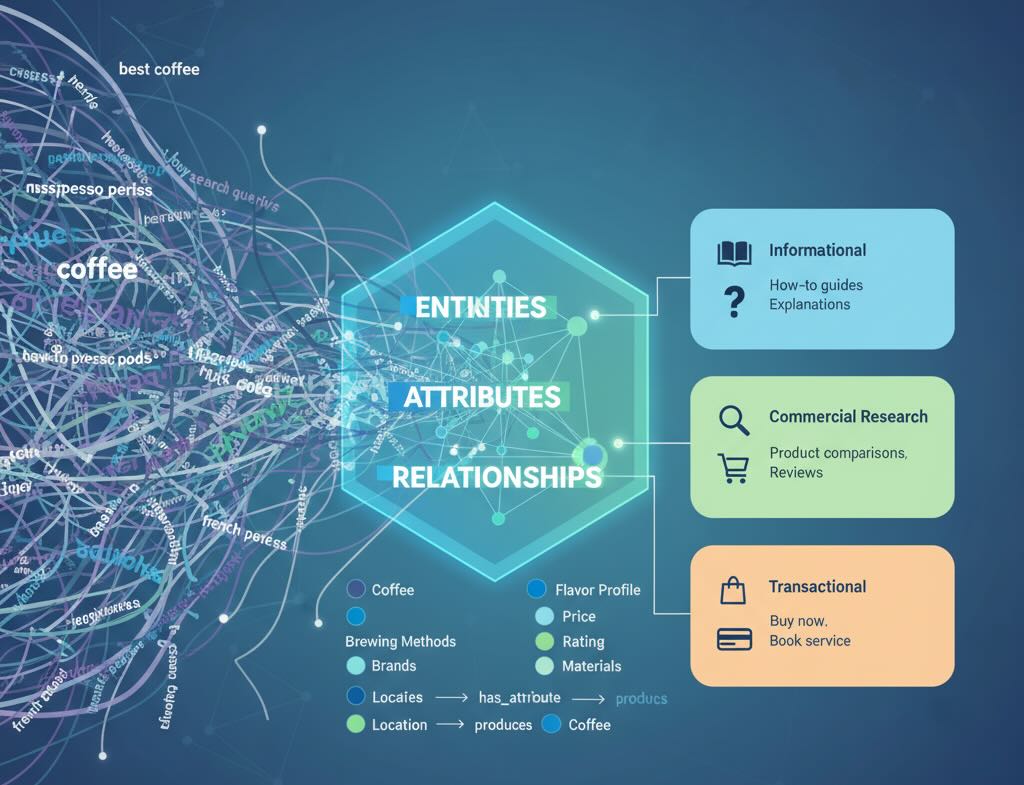
Semantic SEO Analytics: Beyond Keywords to User Intent
Keywords helped us find audiences in the 2010s. In 2026, the edge comes from understanding why someone searches and the…