What Are Core Web Vitals (And Why Should You Care)?
Core Web Vitals are Google’s way of measuring how users actually experience your website. Not how fast your server responds or how optimized your code is — but how the page feels to someone trying to use it.
Since 2021, these metrics have been a confirmed ranking factor. But even if SEO wasn’t a concern, poor Core Web Vitals mean frustrated users, higher bounce rates, and lost conversions (see our guide on website metrics that matter).
The three metrics that matter:
- LCP (Largest Contentful Paint) — How fast does the main content load?
- INP (Interaction to Next Paint) — How responsive is the page when users interact?
- CLS (Cumulative Layout Shift) — Does content jump around while loading?
Let’s break down each one, how to measure them, and — most importantly — how to fix them.
LCP: Largest Contentful Paint
What It Measures
LCP measures when the largest visible element in the viewport finishes loading. This is usually:
- A hero image
- A large text block
- A video poster image
- A background image with text overlay
Google considers the largest element the “main content” because that’s what users are waiting to see.
What’s a Good Score?
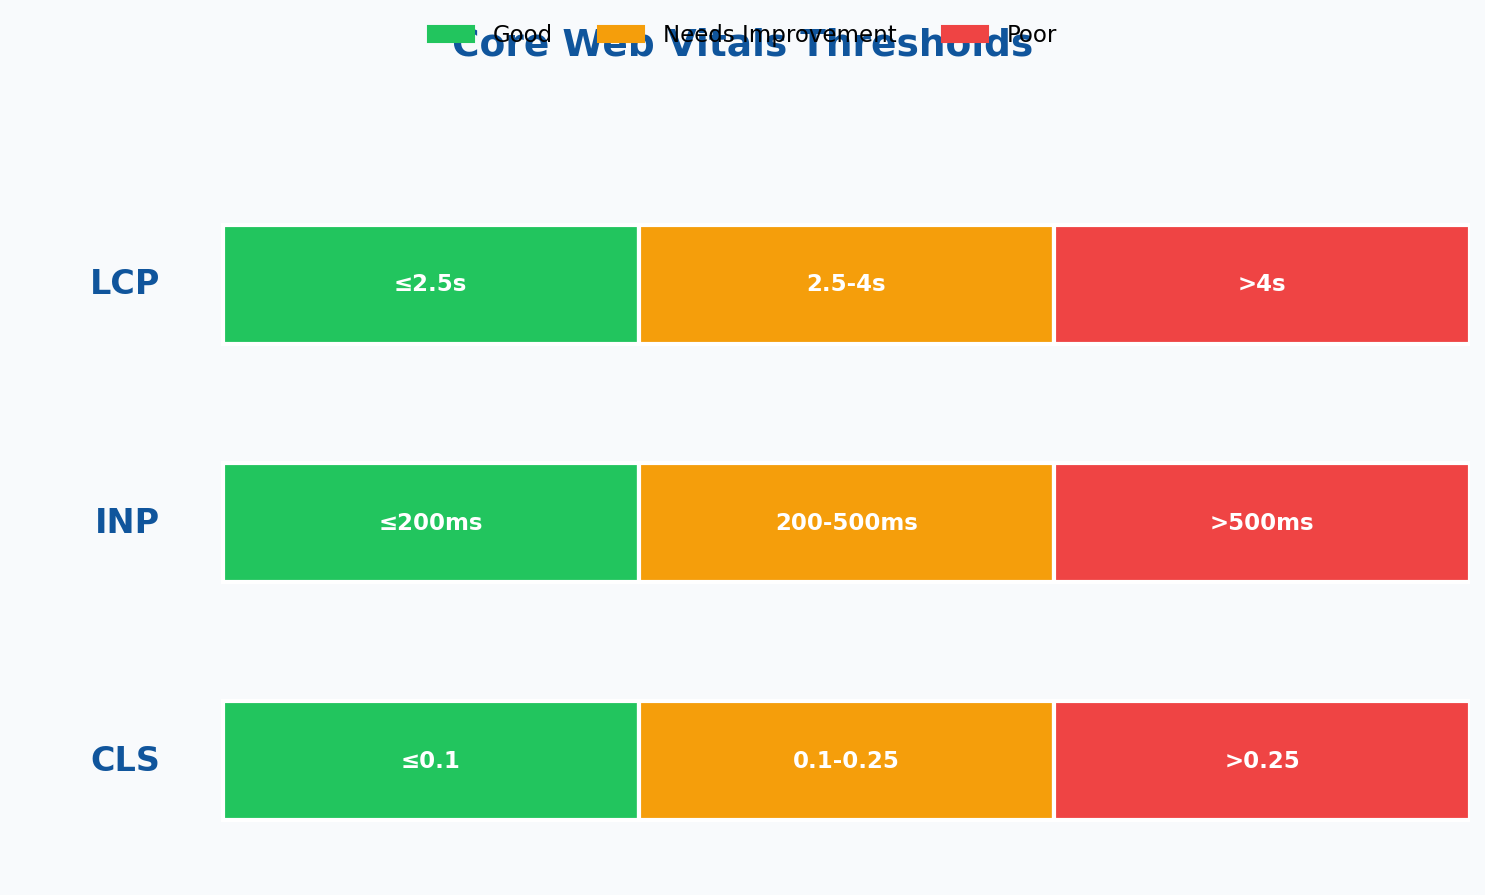
| Rating | LCP Time | What Users Experience |
|---|---|---|
| Good | ≤ 2.5 seconds | Page feels fast |
| Needs Improvement | 2.5 – 4.0 seconds | Noticeable delay |
| Poor | > 4.0 seconds | Users start leaving |
Common LCP Problems and Fixes
Problem 1: Unoptimized images
The hero image is often the LCP element, and it’s often way too large.
<!-- Bad: 2MB hero image -->
<img src="hero-original.jpg" alt="Hero">

<!-- Good: Responsive, optimized images -->
<img
  src="hero-800.webp"
  srcset="hero-400.webp 400w, hero-800.webp 800w, hero-1200.webp 1200w"
  sizes="100vw"
  alt="Hero"
  loading="eager"
  fetchpriority="high"
>
Problem 2: Render-blocking resources
CSS and JavaScript in the <head> block rendering until they’re downloaded and parsed.
Fixes:
- Inline critical CSS (above-the-fold styles)
- Defer non-critical JavaScript:
<script defer src="..."> - Use
rel="preload"for critical resources
Problem 3: Slow server response (TTFB)
If your server takes 2 seconds to respond, your LCP can’t be faster than 2 seconds.
Fixes:
- Use a CDN for static assets
- Enable server-side caching
- Upgrade hosting if needed
- Optimize database queries
INP: Interaction to Next Paint
What It Measures
INP replaced FID (First Input Delay) in March 2024. While FID only measured the first interaction, INP measures responsiveness throughout the entire page visit.
Every time a user clicks, taps, or presses a key, INP measures how long until the browser shows a visual response. The final INP score is typically the worst interaction (with some outliers excluded).
What’s a Good Score?
| Rating | INP Time | What Users Experience |
|---|---|---|
| Good | ≤ 200ms | Instant response |
| Needs Improvement | 200 – 500ms | Slight lag |
| Poor | > 500ms | Feels broken |
Common INP Problems and Fixes
Problem 1: Long JavaScript tasks
Any JavaScript task over 50ms blocks the main thread, making the page unresponsive.
// Bad: One massive function
function processAllData(data) {
  // 500ms of processing...
}

// Good: Break into smaller chunks
async function processDataInChunks(data) {
  for (const chunk of splitIntoChunks(data, 100)) {
    processChunk(chunk);
    await new Promise(r => setTimeout(r, 0)); // Yield to browser
  }
}
Problem 2: Too many event listeners
Each scroll, mousemove, or input event firing expensive handlers kills responsiveness.
Fixes:
- Debounce or throttle event handlers
- Use passive event listeners for scroll:
{ passive: true } - Remove listeners when not needed
Problem 3: Heavy third-party scripts
Chat widgets, analytics, ad scripts — they all compete for the main thread.
Fixes:
- Audit third-party scripts — remove what you don’t need
- Load non-critical scripts after page load
- Use
asyncordeferattributes - Consider web workers for heavy processing
CLS: Cumulative Layout Shift
What It Measures
CLS measures visual stability. Every time a visible element shifts position unexpectedly, it adds to your CLS score.
You’ve experienced bad CLS: you’re about to click a link, and an ad loads above it, pushing the link down. You click the ad instead. Frustrating.
What’s a Good Score?
| Rating | CLS Score | What Users Experience |
|---|---|---|
| Good | ≤ 0.1 | Stable layout |
| Needs Improvement | 0.1 – 0.25 | Occasional shifts |
| Poor | > 0.25 | Content jumping everywhere |
Common CLS Problems and Fixes
Problem 1: Images without dimensions
When an image loads without specified dimensions, the browser doesn’t know how much space to reserve.
<!-- Bad: No dimensions -->
<img src="photo.jpg" alt="Photo">

<!-- Good: Explicit dimensions -->
<img src="photo.jpg" alt="Photo" width="800" height="600">

<!-- Also good: CSS aspect ratio -->
<style>
.responsive-img {
  aspect-ratio: 4 / 3;
  width: 100%;
  height: auto;
}
</style>
Problem 2: Ads and embeds without reserved space
Ads load late and push content down.
<!-- Reserve space for ad -->
<div style="min-height: 250px;">
  <!-- Ad loads here -->
</div>
Problem 3: Web fonts causing text reflow
When a web font loads, text can resize and shift layout.
/* Prevent layout shift from fonts */
@font-face {
  font-family: 'CustomFont';
  src: url('font.woff2') format('woff2');
  font-display: swap; /* or 'optional' for less shift */
  size-adjust: 100.5%; /* Fine-tune to match fallback */
}

body {
  font-family: 'CustomFont', -apple-system, sans-serif;
}
Problem 4: Dynamic content injection
Adding content above existing content causes shifts. Always add below, or reserve space.
How to Measure Core Web Vitals
Lab Data vs. Field Data
There are two types of Core Web Vitals data:
Lab data — Simulated tests in controlled conditions (Lighthouse, PageSpeed Insights simulation). Good for debugging, but doesn’t reflect real user experience.
Field data — Real measurements from actual Chrome users (CrUX data). This is what Google uses for rankings. You need enough traffic (and Chrome users) to get field data.
Measurement Tools
For quick checks:
- PageSpeed Insights — Shows both lab and field data
- Chrome DevTools → Lighthouse tab
- Chrome DevTools → Performance tab (for detailed debugging)
For ongoing monitoring:
- Google Search Console → Core Web Vitals report (field data)
- web-vitals JavaScript library — Track real user metrics
- CrUX Dashboard — Historical field data trends
Tracking Core Web Vitals in Your Analytics
The best way to track Core Web Vitals is with Google’s web-vitals library:
<script type="module">
import {onLCP, onINP, onCLS} from 'https://unpkg.com/web-vitals@4?module';

function sendToAnalytics(metric) {
  // Send to your analytics platform
  const body = JSON.stringify({
    name: metric.name,
    value: metric.value,
    rating: metric.rating,
    delta: metric.delta,
    id: metric.id
  });

  // Use sendBeacon for reliability
  navigator.sendBeacon('/analytics', body);
}

onLCP(sendToAnalytics);
onINP(sendToAnalytics);
onCLS(sendToAnalytics);
</script>
For Google Analytics 4 (or alternatives), you can send as events:
function sendToGA4(metric) {
  gtag('event', metric.name, {
    value: Math.round(metric.name === 'CLS' ? metric.value * 1000 : metric.value),
    metric_id: metric.id,
    metric_value: metric.value,
    metric_rating: metric.rating
  });
}
Prioritizing Fixes: Where to Start
When all three metrics need work, here’s how to prioritize:
1. Fix CLS First
CLS fixes are usually the easiest and have immediate impact. Adding image dimensions or reserving ad space takes minutes.
2. Tackle LCP Second
LCP improvements often require:
- Image optimization (1-2 hours)
- Server improvements (varies)
- Critical CSS extraction (2-4 hours)
3. Address INP Last
INP problems usually require JavaScript refactoring, which takes longer and carries more risk. Start with quick wins like deferring third-party scripts.
Common Mistakes to Avoid
Mistake 1: Only testing on fast connections
Your fiber connection isn’t representative. Test with throttling:
- Chrome DevTools → Network tab → Throttle to “Slow 3G”
- Performance tab → CPU throttle to 4x slowdown
Mistake 2: Ignoring mobile
Google uses mobile Core Web Vitals for ranking. Mobile devices have slower CPUs and networks — problems are amplified.
Mistake 3: Optimizing for lab scores only
Your Lighthouse score can be 100 while real users have a poor experience. Always validate with field data.
Mistake 4: Breaking functionality for speed
Don’t remove essential features just to hit arbitrary numbers. A fast but unusable site is worse than a slightly slower functional one.
Quick Wins Checklist
Start here for immediate improvements:
LCP Quick Wins:
- ☐ Compress and resize hero images
- ☐ Convert images to WebP format
- ☐ Add
fetchpriority="high"to LCP image - ☐ Preload critical fonts
- ☐ Enable browser caching
INP Quick Wins:
- ☐ Defer non-critical JavaScript
- ☐ Remove unused third-party scripts
- ☐ Add
loading="lazy"to below-fold images - ☐ Use
passive: truefor scroll listeners
CLS Quick Wins:
- ☐ Add width/height to all images
- ☐ Reserve space for ads and embeds
- ☐ Use
font-display: swap - ☐ Avoid inserting content above existing content
The Bottom Line
Core Web Vitals aren’t just another SEO checkbox. They measure real user experience — and Google rewards sites that prioritize their users.
Start by measuring where you actually stand (field data, not just lab tests). Fix CLS first for quick wins. Then systematically work through LCP and INP.
Remember: the goal isn’t a perfect Lighthouse score. It’s a site that loads fast, responds instantly, and doesn’t frustrate users. The rankings will follow.