You’re collecting website data. But are you tracking the right metrics — the ones that actually predict business growth?
Most analytics dashboards overwhelm you with numbers. Pageviews, sessions, bounce rates, exit rates — it’s easy to confuse activity with progress. The metrics that matter depend on your goals: are you building awareness, generating leads, or driving sales?
This guide cuts through the noise. I’ll cover the website metrics that actually inform decisions, show you realistic benchmarks, and explain what to do when numbers don’t look right.
What Are Website Metrics?
Website metrics are quantifiable measurements of how visitors interact with your site. They tell you what’s working, what’s broken, and where opportunities hide.
But here’s what most guides miss: metrics without context are meaningless. A 70% bounce rate is terrible for an e-commerce product page but perfectly normal for a blog post that answers a quick question. A 2% conversion rate is excellent for B2B software but weak for a simple email signup.
The key is matching metrics to intent — yours and your visitors’.
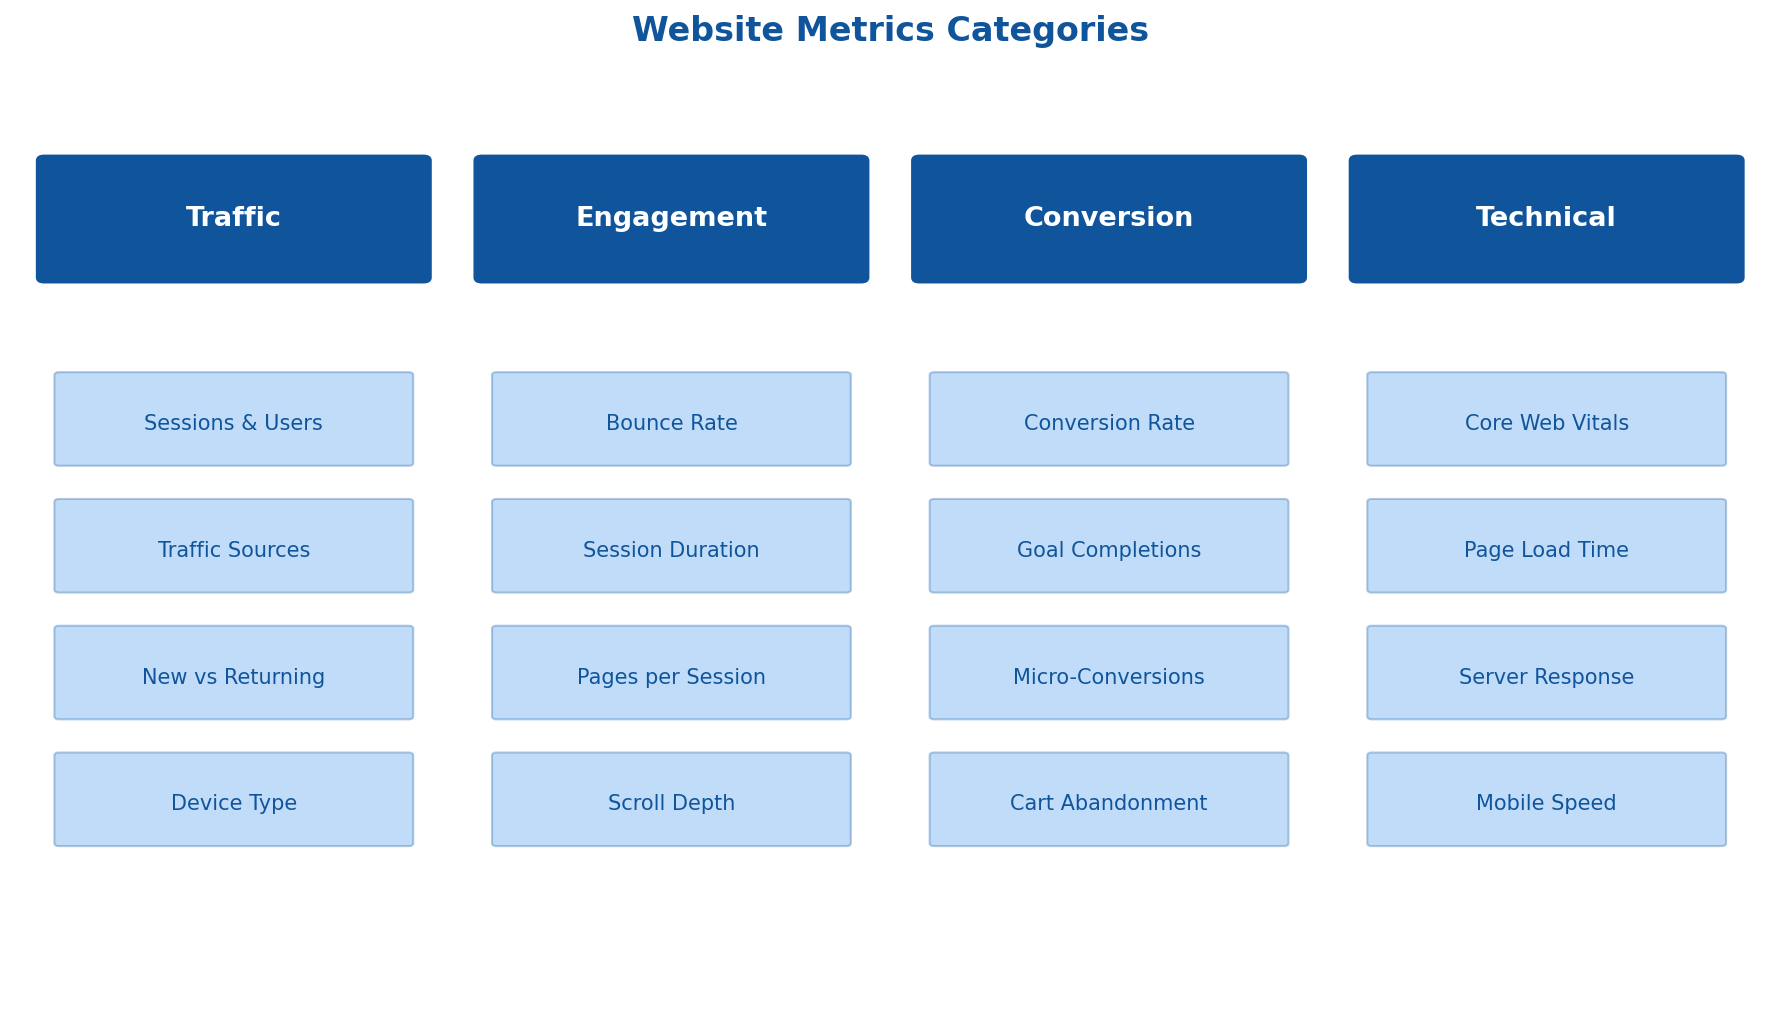
Traffic Metrics: Who’s Coming and From Where
Traffic metrics measure volume and acquisition. They answer: “Are we reaching people, and how are they finding us?”
Sessions and Users
Sessions count visits to your site. One user can generate multiple sessions. Users (or unique visitors) count individual people, typically identified by cookies or device fingerprints.
What to watch:
- Sessions growing faster than users = returning visitors (good for engagement)
- Users growing faster than sessions = new audience discovery (good for awareness)
- Both flat = you’ve hit a plateau; time to expand channels or content
Privacy note: With cookie consent requirements and tracking prevention, user counts are increasingly undercounted. Focus on trends over absolute numbers, and consider cookieless tracking alternatives for more accurate measurement.
Traffic Sources
Where visitors originate reveals which channels drive results:
| Source | What It Tells You | Watch For |
|---|---|---|
| Organic Search | SEO effectiveness | Keyword rankings, landing page performance |
| Direct | Brand recognition, bookmarks | Often inflated by tracking gaps (dark traffic) |
| Referral | Backlinks, partnerships working | Quality of referring sites |
| Paid | Ad campaign performance | Cost per visit, landing page relevance |
| Social | Social media ROI | Which platforms convert vs. just drive visits |
| List engagement | Campaign-level performance |
Benchmark: Healthy sites typically see 40-60% organic, 20-30% direct, and the rest split across paid, social, and referral. Over-reliance on any single channel is a risk.
New vs. Returning Visitors
This ratio reveals your content strategy’s balance:
- High new visitor % (70%+): You’re acquiring well but may struggle with retention
- High returning visitor % (50%+): Strong loyalty but potentially limited reach
- Healthy balance: 60-70% new, 30-40% returning for most content sites
E-commerce sites often skew toward new visitors (people buy and leave), while SaaS and media sites need stronger returning numbers.
Device Breakdown
Mobile now accounts for over 60% of web traffic globally. But conversion rates on mobile typically lag desktop by 50% or more.
What matters:
- If mobile traffic is high but mobile conversions are low, your mobile experience needs work
- Compare bounce rates and time on page across devices — big gaps indicate UX problems
- Don’t just check “mobile” — tablet behavior often differs from phone behavior
Engagement Metrics: Are Visitors Actually Interested?
Traffic is vanity. Engagement is sanity. These metrics reveal whether visitors find value.
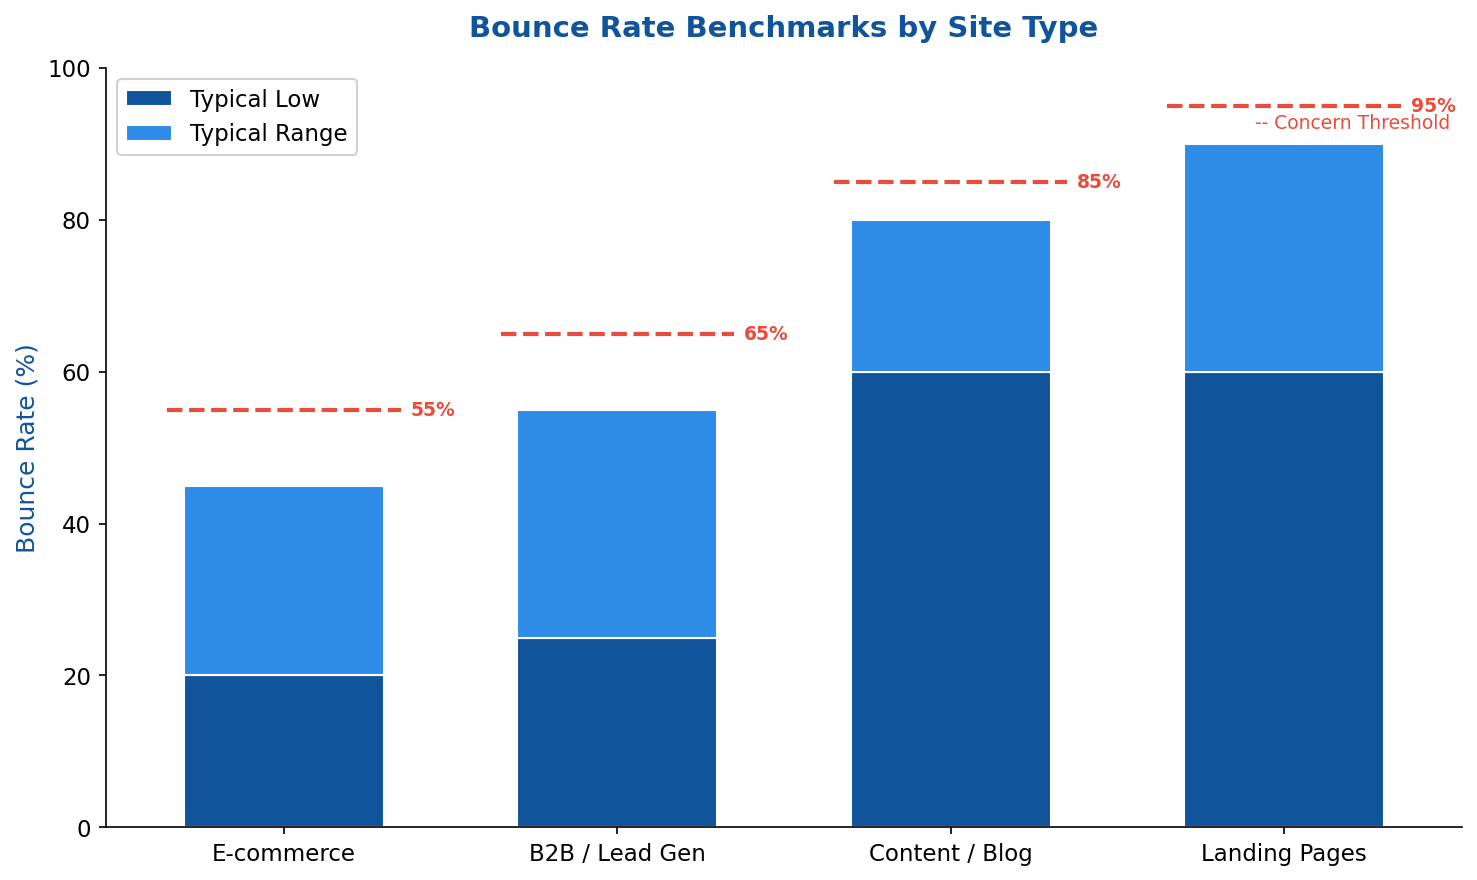
Bounce Rate
Bounce rate measures single-page sessions — visitors who land and leave without further interaction.
Important: In GA4, bounce rate is now the inverse of “engagement rate.” A session counts as engaged if it lasts 10+ seconds, has 2+ pageviews, or triggers a conversion event. This makes GA4 bounce rates lower than Universal Analytics was.
When high bounce rate is fine:
- Blog posts that answer questions completely
- Contact pages where visitors grab your phone number
- Single-page tools or calculators
When high bounce rate is a problem:
- Product pages (visitors should explore more)
- Homepage (should lead somewhere)
- Pages with clear next-step CTAs that nobody clicks
Average Session Duration
How long visitors spend per session. Longer isn’t always better — it depends on the page’s purpose.
Benchmarks:
- E-commerce: 2-4 minutes (browsing products)
- B2B sites: 2-5 minutes (researching solutions)
- Blogs: 1-3 minutes (depends on content length)
- SaaS landing pages: 30-90 seconds (quick evaluation)
Watch for: Very short durations (<30 seconds) usually signal mismatched expectations — visitors didn't find what they expected from the search result or ad.
Pages Per Session
Average number of pages viewed per visit. Higher numbers suggest visitors are exploring and finding relevant content.
Benchmarks:
- E-commerce: 4-8 pages (browsing behavior)
- Content sites: 1.5-3 pages
- B2B: 2-4 pages
How to improve:
- Internal linking to related content
- Clear navigation and content recommendations
- “Related products” or “You might also like” sections
- Compelling CTAs that lead deeper into the site
Scroll Depth
How far down the page visitors scroll. Most analytics tools don’t track this by default — you’ll need to set up custom events.
Why it matters: If 80% of visitors never scroll past the first screen, your above-the-fold content either satisfies them immediately or fails to hook them. If important CTAs are below the fold and scroll depth is low, move them up.
Typical pattern: 70-80% reach 25% depth, 50-60% reach 50%, 30-40% reach 75%, 20-30% reach 100%.
Conversion Metrics: Are Visitors Taking Action?
Conversion metrics measure business outcomes. Everything else is context for understanding these numbers.
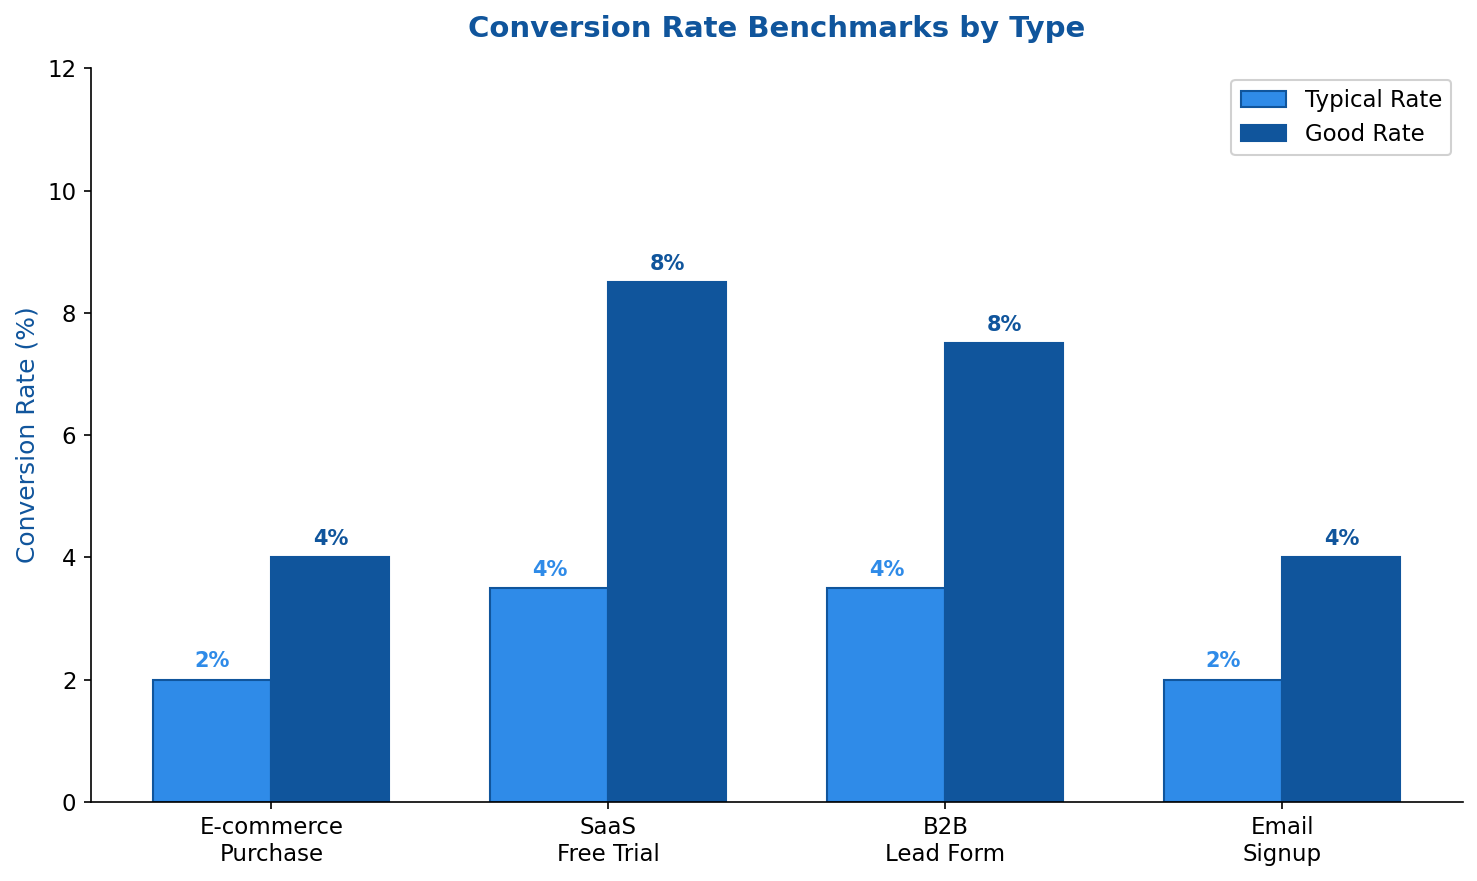
Conversion Rate
The percentage of sessions (or users) that complete a desired action. The definition of “conversion” varies by business:
- E-commerce: Purchase
- SaaS: Free trial signup, demo request
- Lead gen: Form submission, phone call
- Content: Newsletter signup, resource download
For detailed breakdowns, see our guide on conversion rate types and calculations.
Segment your conversion rates. Overall site conversion rate hides important patterns. Break it down by:
- Traffic source (paid vs. organic often differ dramatically)
- Device type (mobile usually converts lower)
- Landing page (identify top and bottom performers)
- New vs. returning visitors
Goal Completions
The absolute number of conversions, not the rate. Important because:
- A page with 2% conversion rate and 100 visits = 2 conversions
- A page with 1% conversion rate and 1,000 visits = 10 conversions
Optimizing conversion rate matters, but volume matters too. Sometimes driving more traffic to a decent page beats obsessing over rate optimization.
Micro-Conversions
Smaller actions that indicate progress toward the main goal:
- Adding to cart (before purchase)
- Viewing pricing page (before signup)
- Watching product video (before demo request)
- Downloading a resource (before becoming a lead)
Tracking micro-conversions helps you identify where the funnel leaks. If many visitors add to cart but few purchase, the problem is checkout — not product interest.
Cart Abandonment Rate
Percentage of shoppers who add items to cart but don’t complete purchase. E-commerce specific but critical.
Benchmark: Average cart abandonment is 70% across industries. Under 60% is good; over 80% signals serious friction.
Common causes:
- Unexpected shipping costs (revealed too late)
- Required account creation
- Complex checkout process
- Payment security concerns
- Limited payment options
Technical Performance Metrics: Is Your Site Fast Enough?
Page speed directly impacts both user experience and SEO rankings. Google uses Core Web Vitals as ranking signals.
Core Web Vitals
Google’s three key performance metrics:
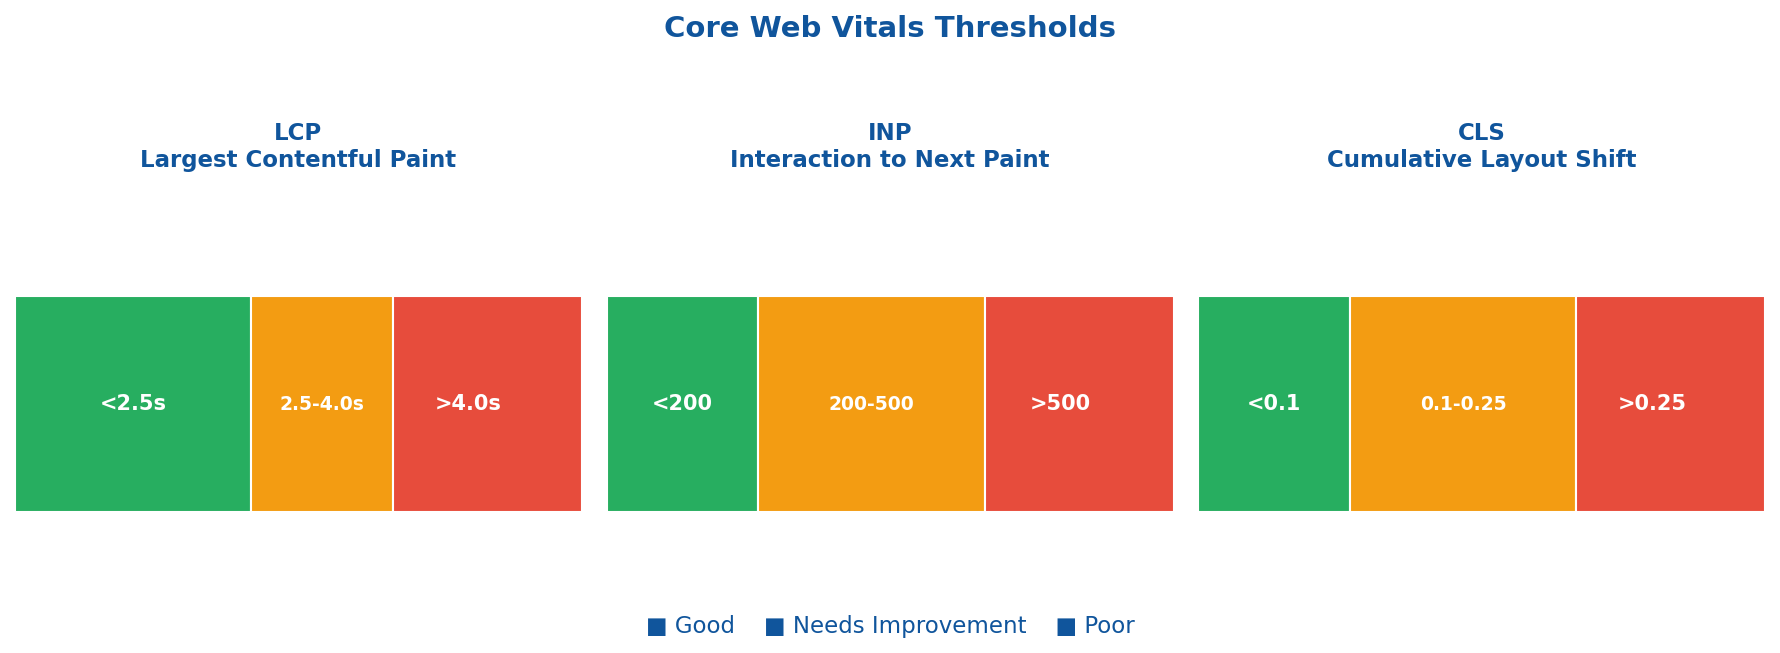
Largest Contentful Paint (LCP) — How fast the main content loads
- Good: Under 2.5 seconds
- Needs improvement: 2.5-4 seconds
- Poor: Over 4 seconds
Interaction to Next Paint (INP) — How fast the page responds to interactions
- Good: Under 200 milliseconds
- Needs improvement: 200-500ms
- Poor: Over 500ms
Cumulative Layout Shift (CLS) — Visual stability (elements not jumping around)
- Good: Under 0.1
- Needs improvement: 0.1-0.25
- Poor: Over 0.25
Where to check: Google Search Console (Core Web Vitals report), PageSpeed Insights, or Chrome DevTools.
Page Load Time
Total time until the page is fully loaded and interactive.
Benchmark: Under 3 seconds. Every additional second increases bounce probability by ~32%.
Research shows: A 0.1-second improvement in load time can increase conversion rates by 8% and boost pages per session by 9%.
Server Response Time (TTFB)
Time To First Byte — how long until the server starts sending data.
Benchmark: Under 200ms is good. Over 600ms indicates server-side problems (slow database, overloaded hosting, unoptimized backend).
SEO Metrics: How Visible Are You?
These metrics connect website performance to search visibility.
Organic Traffic Trend
Month-over-month and year-over-year organic session changes. More reliable than absolute numbers because it accounts for seasonality and market growth.
What to watch:
- Sudden drops may indicate algorithm updates, technical issues, or lost rankings
- Gradual decline suggests content is aging or competition is increasing
- Growth should roughly track your content investment
Keyword Rankings
Positions in search results for target keywords. Track:
- Branded keywords: Your company name (should rank #1)
- Non-branded keywords: Industry terms, problem-based queries
- Long-tail keywords: Specific phrases with lower volume but higher intent
Tools: Google Search Console (free), Ahrefs, SEMrush, or Moz for detailed tracking.
Click-Through Rate (CTR) from Search
Percentage of impressions that result in clicks. Found in Google Search Console.
Benchmarks by position:
- Position 1: 25-35% CTR
- Position 2: 12-18% CTR
- Position 3: 8-12% CTR
- Positions 4-10: 2-8% CTR
If your CTR is significantly below these benchmarks, your title tags and meta descriptions may need work — you’re ranking but not compelling clicks.
Choosing the Right Analytics Tool
The tool matters less than consistent tracking. But different tools have different strengths:
| Tool | Best For | Privacy | Cost |
|---|---|---|---|
| Google Analytics 4 | Comprehensive, free, Google Ads integration | Data shared with Google | Free |
| Matomo | Privacy-first, self-hosted option | 100% data ownership | Free (self-hosted) / €19+/mo |
| Plausible | Simple, lightweight, GDPR-friendly | No cookies needed | From $9/mo |
| Fathom | Privacy-focused, simple interface | No cookies needed | From $14/mo |
| Umami | Open-source, self-hosted | Full control | Free (self-hosted) |
For a detailed comparison, see our guide to Google Analytics alternatives.
Building a Metrics Dashboard That Works
Don’t track everything. Build a focused dashboard based on your business model:
For E-commerce
- Revenue and transactions
- Conversion rate (overall and by traffic source)
- Average order value
- Cart abandonment rate
- Top products by revenue
- Mobile vs. desktop conversion gap
For SaaS / Lead Gen
- Trial signups or demo requests
- Conversion rate by source
- Lead quality (if connected to CRM)
- Pricing page visits to signup ratio
- Content performance (which pages drive leads)
For Content / Media
- Pageviews and unique visitors
- Average time on page
- Pages per session
- Newsletter signup rate
- Top content by traffic and engagement
- Traffic source breakdown
When Metrics Look Bad: A Troubleshooting Guide
Numbers going wrong? Here’s where to look:
High bounce rate + low time on page:
- Content doesn’t match search intent
- Slow page load driving people away
- Poor mobile experience
- Misleading title tags or meta descriptions
Good traffic + low conversions:
- Wrong audience (check traffic sources)
- Weak calls-to-action
- Friction in conversion process
- Trust issues (missing social proof, security signals)
High cart abandonment:
- Surprise costs at checkout
- Required account creation
- Limited payment options
- Too many form fields
Declining organic traffic:
- Algorithm update impact (check industry news)
- Technical SEO issues (crawl errors, indexing problems)
- Content freshness (competitors publishing newer content)
- Lost backlinks
Key Takeaways
- Match metrics to goals: E-commerce needs conversion focus; content sites need engagement focus
- Context matters: A “bad” bounce rate might be fine depending on page purpose
- Segment everything: Overall averages hide the insights in device, source, and page-level data
- Technical performance is foundational: Speed issues undermine everything else
- Less is more: A focused dashboard beats tracking dozens of metrics nobody reviews
- Trends over absolutes: With privacy changes affecting tracking accuracy, directional movement matters more than precise numbers
Website metrics exist to inform decisions, not to fill dashboards. Pick the numbers that connect to your actual business goals, establish benchmarks, and focus your optimization efforts where they’ll move the needle.