Your marketing data lives in silos. Google Ads says one thing, Facebook another, and your email platform tells a completely different story. You’re making budget decisions based on fragmented data — and probably misattributing conversions in the process.
Cross-channel analytics solves this by connecting the dots between every touchpoint in your customer’s journey. Instead of asking “which channel converted?” you start asking “how did all channels work together to convert?”
In this guide, I’ll walk you through implementing cross-channel analytics the right way — with practical steps, attribution model comparisons, and privacy-compliant approaches that actually work in 2025.
What Is Cross-Channel Analytics?
Cross-channel analytics is the practice of collecting, unifying, and analyzing customer interaction data from every marketing channel to understand how they collectively drive conversions. It goes beyond measuring individual channel performance to reveal the complete customer journey.
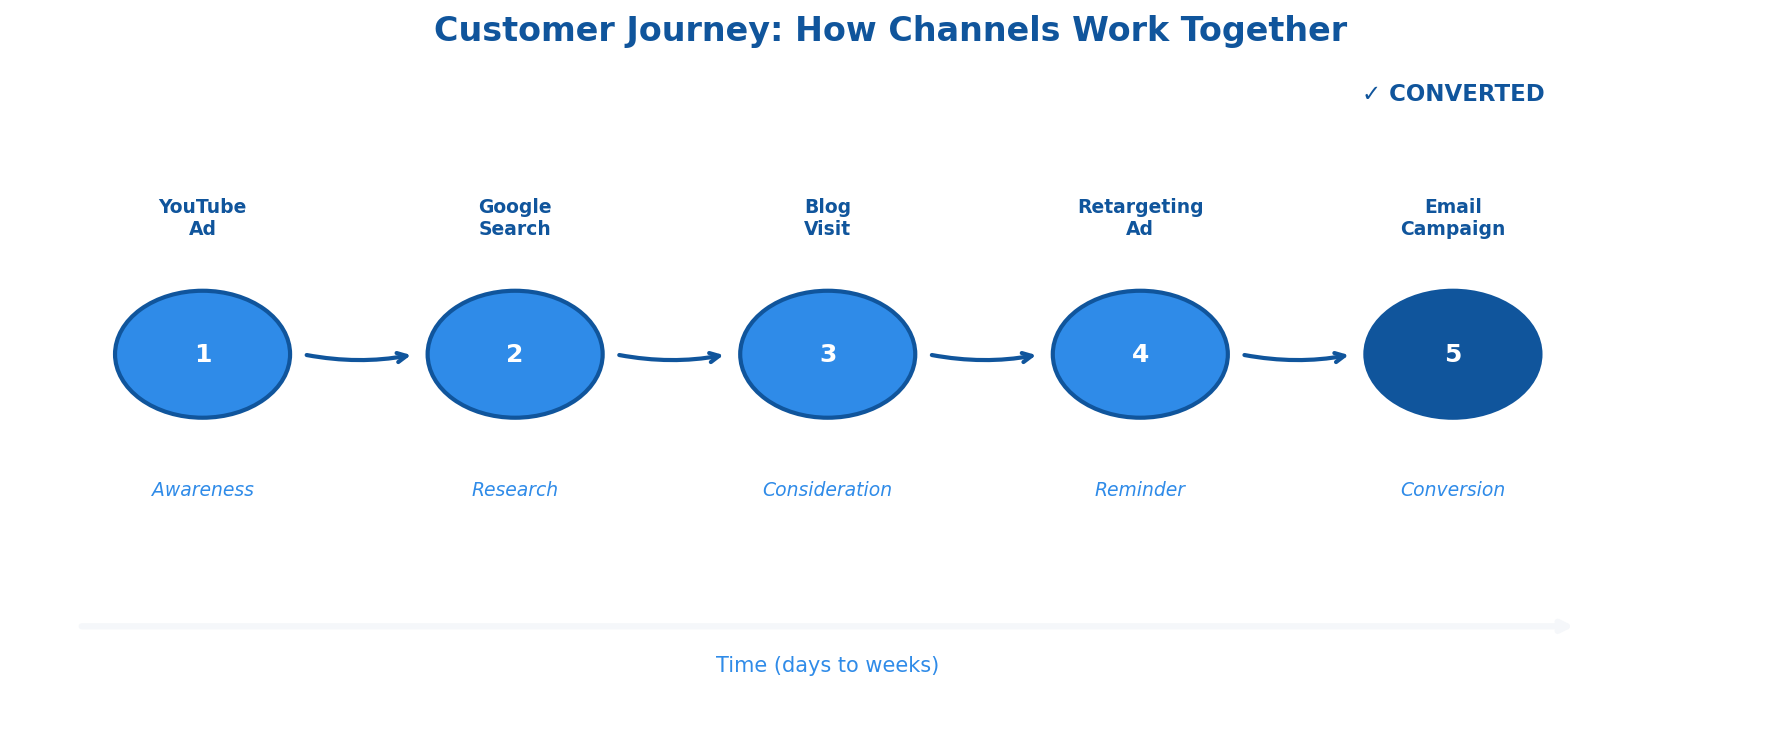
Think of it this way: a customer might discover your brand through a YouTube ad, research you via organic search, click a retargeting ad on Instagram, and finally convert through an email campaign. Traditional analytics would credit only the email (last-click) or only YouTube (first-click). Cross-channel analytics shows you the full picture.
Cross-Channel vs. Multi-Channel Analytics
These terms get confused constantly. Here’s the distinction:
| Aspect | Multi-Channel Analytics | Cross-Channel Analytics |
|---|---|---|
| Scope | Measures channels individually | Measures all channels + their interactions |
| Data structure | Separate silos per channel | Unified customer view |
| Attribution | Single-touch (first or last click) | Multi-touch across journey |
| Question answered | “How did each channel perform?” | “How did channels work together?” |
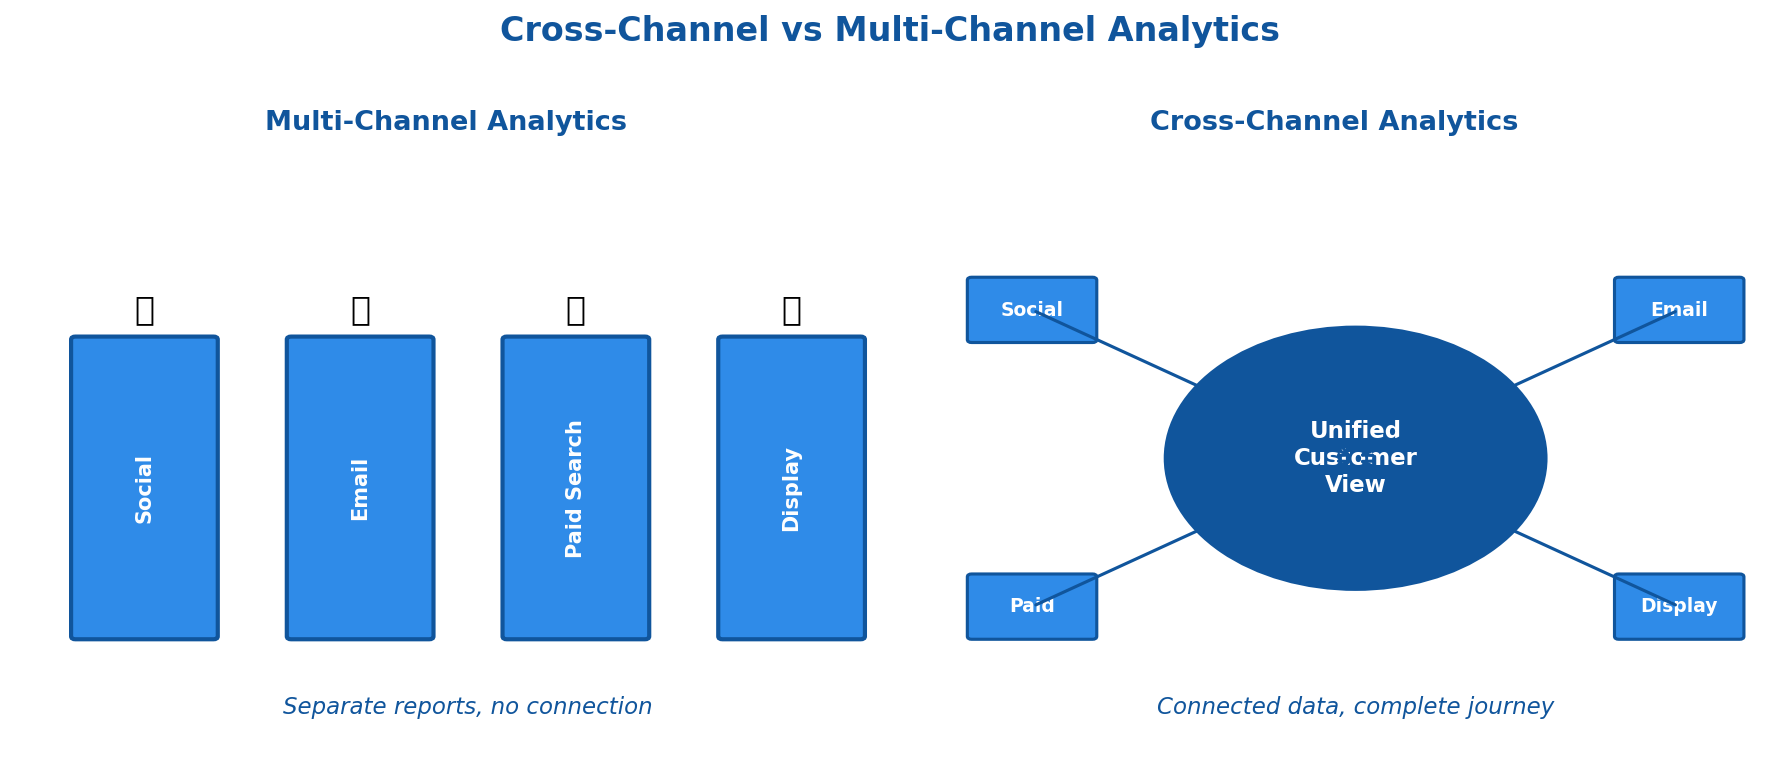
Multi-channel tells you Facebook generated 500 conversions. Cross-channel tells you Facebook assisted 2,000 conversions that were attributed elsewhere — completely changing how you’d allocate budget.
Why Cross-Channel Analytics Matters Now
Three shifts make cross-channel analytics essential in 2025:
1. Customer journeys are fragmented. The average B2B buyer now uses 10+ channels during their research process. B2C isn’t far behind. Single-channel attribution misses most of the story.
2. Privacy changes broke traditional tracking. With third-party cookies disappearing and iOS limiting tracking, connecting touchpoints requires new approaches. Cross-channel analytics built on first-party data is more resilient.
3. Marketing budgets face scrutiny. CFOs want proof. “Facebook looks expensive on last-click” isn’t a strategy. Cross-channel data shows true channel value and justifies spend with complete attribution.
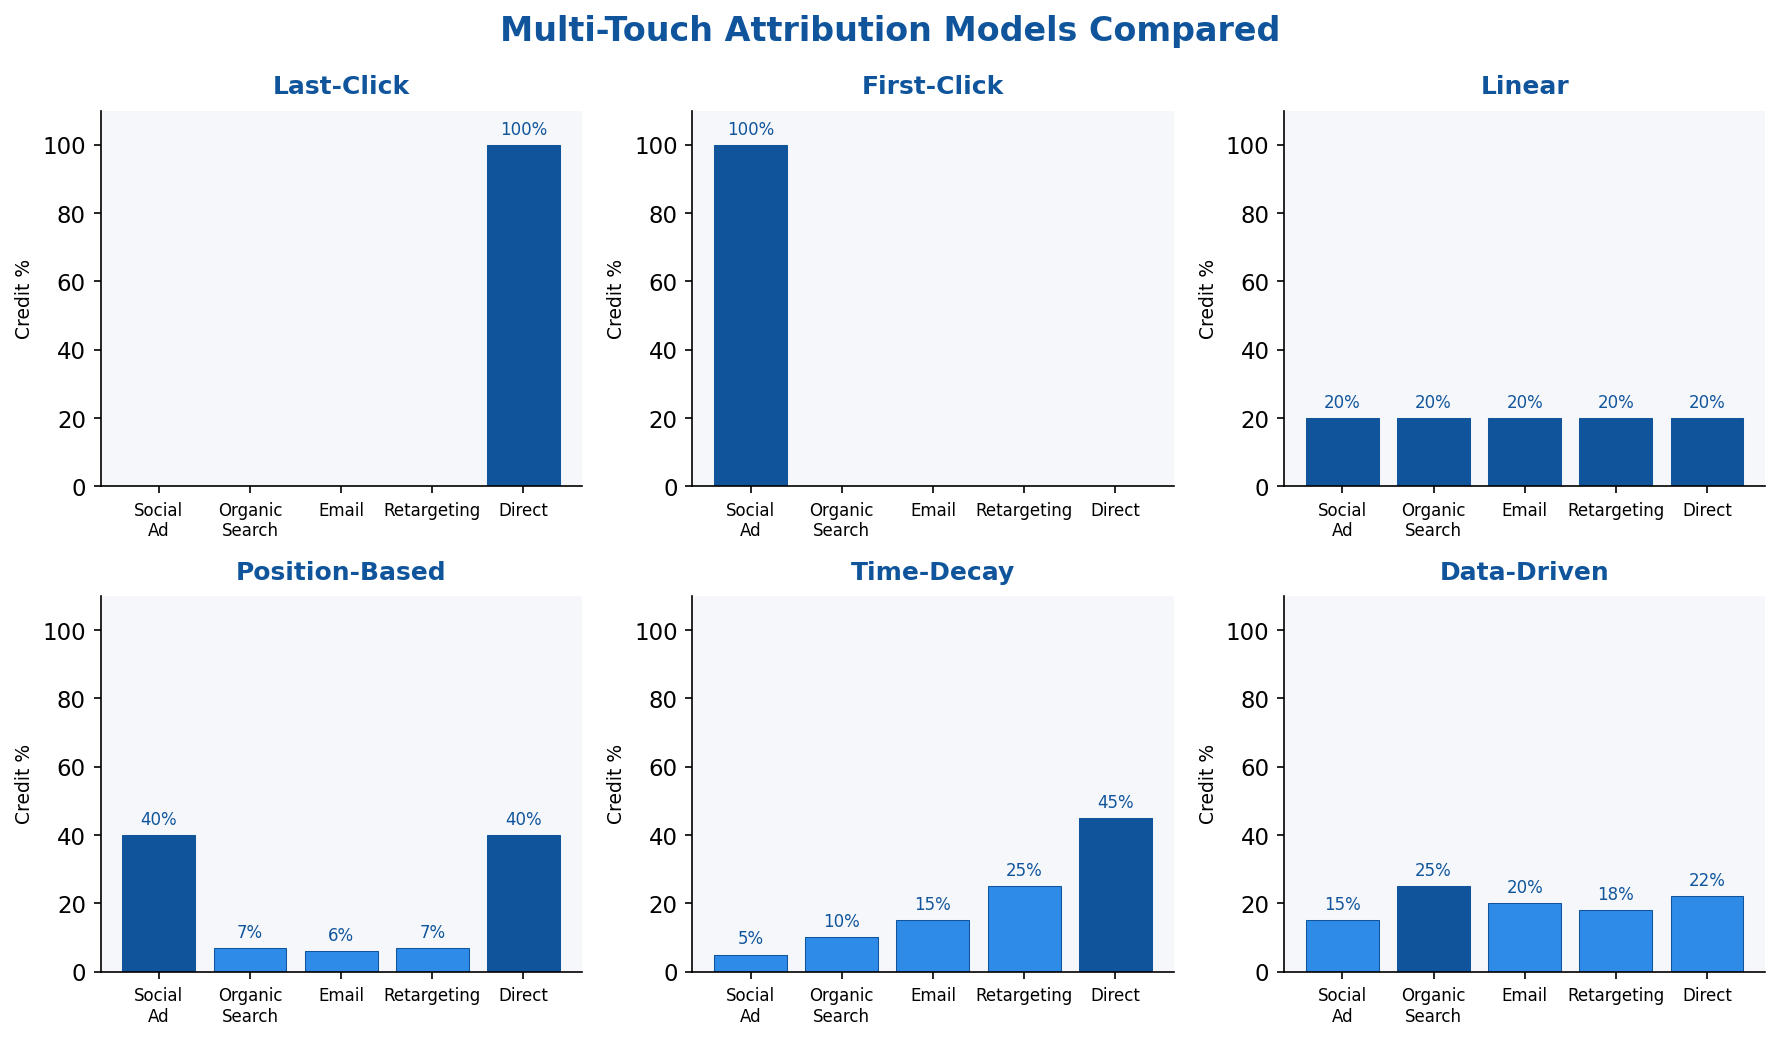
Multi-Touch Attribution Models Explained
Attribution models determine how conversion credit gets distributed across touchpoints. Choosing the right model directly impacts your budget decisions.
Rule-Based Models
Last-Click Attribution
100% credit to the final touchpoint before conversion. Simple but misleading — it ignores everything that built awareness and consideration.
Best for: Short sales cycles, impulse purchases, when you genuinely only care about closers.
First-Click Attribution
100% credit to the first touchpoint. Useful for understanding acquisition channels but ignores nurturing efforts.
Best for: Brand awareness campaigns, top-of-funnel optimization.
Linear Attribution
Equal credit to every touchpoint. Fair but naive — not all touches contribute equally.
Best for: When you’re starting out and need a baseline before optimizing.
Position-Based (U-Shaped)
40% to first touch, 40% to last touch, 20% distributed across middle touchpoints. Acknowledges that introduction and conversion moments matter most.
Best for: Most B2B scenarios, considered purchases with research phases.
Time-Decay
More credit to touchpoints closer to conversion. Recent interactions get weighted higher.
Best for: Short consideration windows, promotional campaigns, e-commerce.
Data-Driven Attribution
Machine learning models analyze your actual conversion paths to determine credit. Google Analytics 4 uses this as default. The model learns which touchpoint combinations predict conversions in your specific business.
Best for: High-volume businesses (needs significant data), when rule-based models don’t match your reality.
Important caveat: Attribution models measure correlation, not causation. A touchpoint appearing in conversion paths doesn’t prove it influenced the outcome. For true incrementality, you need holdout tests alongside attribution data.
Implementing Cross-Channel Analytics: Step by Step
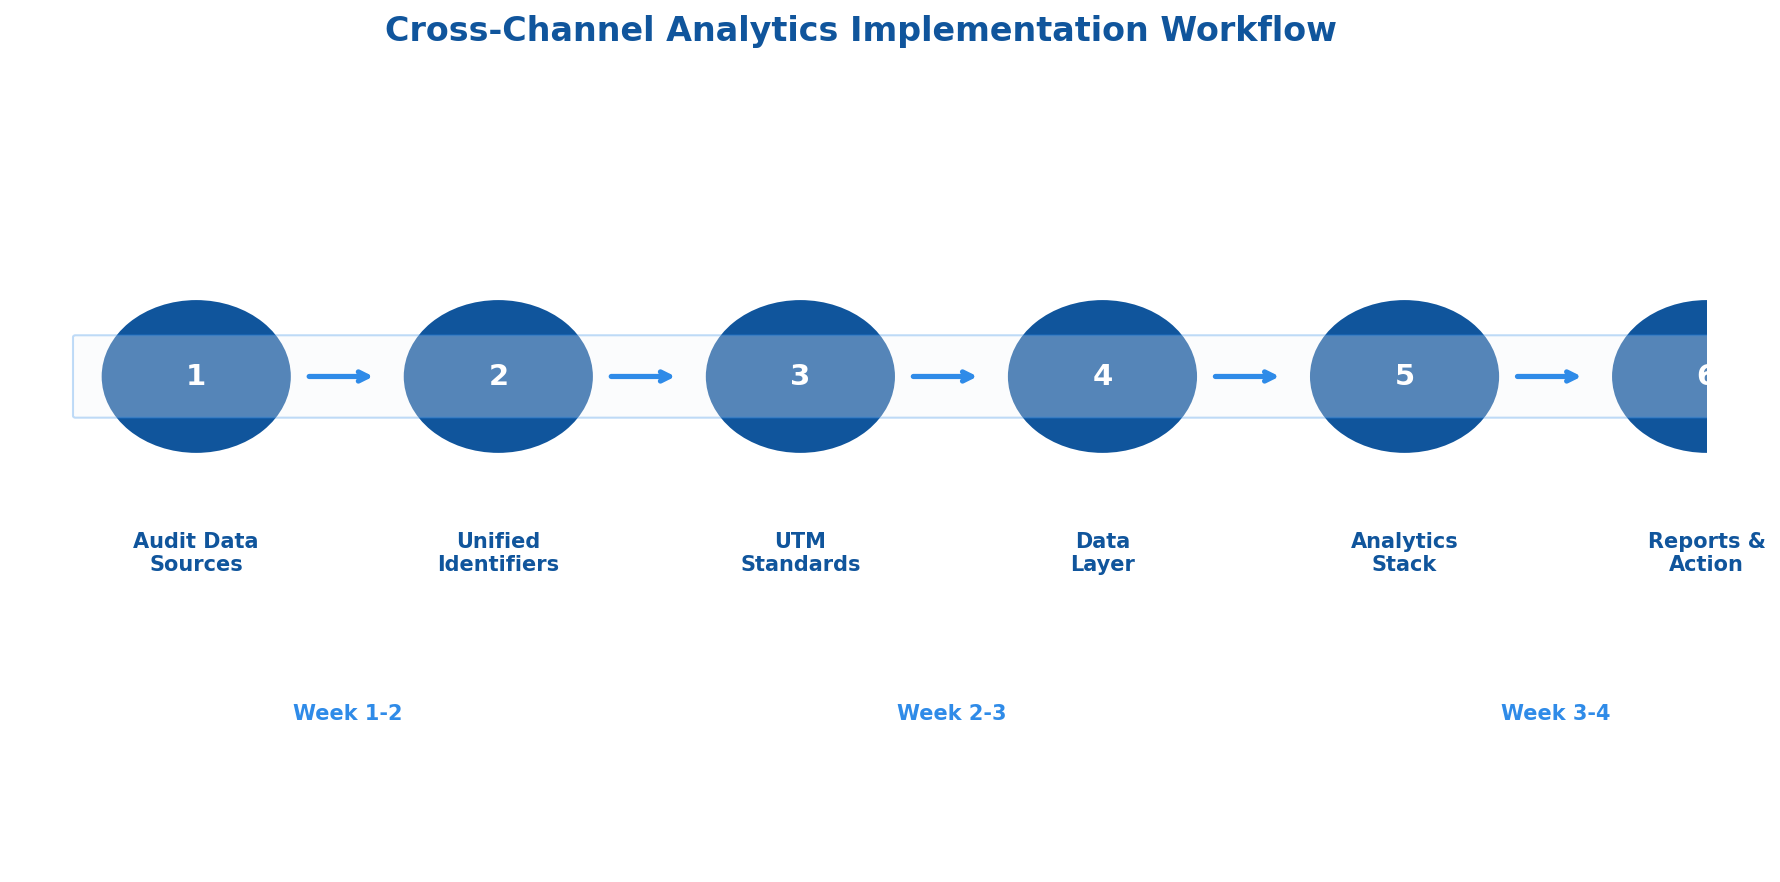
Step 1: Audit Your Current Data Sources
Before building anything, map what you have:
- Advertising platforms: Google Ads, Meta, LinkedIn, TikTok, etc.
- Web analytics: GA4, Matomo, Plausible, or other alternatives
- CRM: Salesforce, HubSpot, Pipedrive
- Email/marketing automation: Klaviyo, Mailchimp, ActiveCampaign
- E-commerce platform: Shopify, WooCommerce, Magento
Document what each platform tracks, what identifiers it uses, and how data can be exported. Most cross-channel implementations fail because teams underestimate data fragmentation.
Step 2: Establish a Unified Identifier Strategy
Cross-channel analytics requires connecting the same user across platforms. Your options:
Email-based matching: When users log in or submit forms, their email becomes the key linking all interactions. Privacy-friendly but requires authenticated touchpoints.
First-party cookies + user IDs: Assign a persistent ID on first visit, associate it with known identity when they convert or log in. Works across sessions on the same device.
Customer Data Platform (CDP): Tools like Segment, RudderStack, or mParticle handle identity resolution automatically, merging anonymous and known profiles.
Whatever you choose, document it. Inconsistent identifiers are the #1 cause of broken cross-channel data.
Step 3: Implement Consistent UTM Tracking
UTM parameters must be standardized across every campaign, every channel, every team member. Create a UTM governance document:
utm_source: [platform] — google, facebook, linkedin, email
utm_medium: [channel type] — cpc, social, email, referral
utm_campaign: [campaign name] — use consistent naming convention
utm_content: [ad/creative variant] — for A/B testing
utm_term: [keyword] — for paid search
Common mistakes that break cross-channel data:
- Inconsistent capitalization (Facebook vs facebook vs fb)
- Missing UTMs on some campaigns
- Different naming conventions across teams
- Not tagging email campaigns
Step 4: Create a Centralized Data Layer
Your analytics tools need standardized event data. Implement a data layer that fires consistent events regardless of the source:
dataLayer.push({
  'event': 'purchase',
  'transaction_id': 'TXN-12345',
  'value': 149.99,
  'currency': 'USD',
  'items': [...],
  'attribution': {
    'first_touch_source': 'google',
    'first_touch_medium': 'cpc',
    'last_touch_source': 'email',
    'last_touch_medium': 'newsletter'
  }
});
This data layer feeds your analytics platform with conversion data enriched by attribution context.
Step 5: Choose Your Analytics Stack
Three approaches, depending on your resources:
Option A: All-in-one platform
Tools like Matomo, Plausible, or GA4 handle collection and reporting in one place. Simpler setup, less flexibility.
Option B: CDP + analytics
Segment or RudderStack collects data, then routes to your analytics and advertising platforms. More control, better identity resolution.
Option C: Data warehouse + BI
ETL tools (Fivetran, Airbyte) pull data into BigQuery/Snowflake, then visualize in Looker or Tableau. Maximum flexibility, requires data engineering resources.
For most marketing teams, Option A or B makes sense. Option C is for organizations with dedicated data teams.
Step 6: Build Cross-Channel Reports
Essential reports for cross-channel analytics:
Channel Interaction Report: Shows how often channels appear together in conversion paths. Reveals which channels assist vs. close.
Path Length Analysis: How many touchpoints before conversion? If average is 8 touchpoints, single-touch attribution is definitely wrong.
Time Lag Report: Days between first touch and conversion. Critical for setting attribution windows and understanding your sales cycle.
Assisted Conversion Value: Revenue attributed to channels in assist positions vs. last-click. Often reveals that “underperforming” channels are actually essential.
Privacy-Compliant Cross-Channel Tracking
Cross-channel analytics and privacy aren’t mutually exclusive — but implementation matters.
First-Party Data Foundation
Build your cross-channel system on first-party data: information users provide directly through forms, accounts, and purchases. This data survives cookie deprecation and satisfies most privacy regulations.
Consent-Based Tracking
Implement proper consent management:
- Only fire tracking pixels after explicit consent
- Offer granular choices (analytics vs. advertising)
- Respect opt-outs across all connected platforms
- Document consent status alongside user data
Server-Side Tracking
Move tracking from browser to server where possible. Server-side implementations:
- Aren’t blocked by ad blockers
- Give you control over what data is shared
- Work with first-party cookies only
- Can strip PII before sending to third parties
Tools like Google Tag Manager Server-Side, Segment, or custom implementations enable this approach.
Cross-Channel Analytics Tools Compared
Choosing the right tool depends on your technical resources, privacy requirements, and existing stack.
| Tool | Best For | Attribution | Privacy | Pricing |
|---|---|---|---|---|
| Google Analytics 4 | Existing Google stack users | Data-driven (default) | Mixed (data sampling, Google access) | Free / GA360 paid |
| Matomo | Privacy-first, self-hosted control | Multiple models | Strong (100% data ownership) | Free self-hosted / Cloud from €19/mo |
| Segment | CDP-first approach, many integrations | Passes to destinations | Good (you control data flow) | Free tier / Team from $120/mo |
| Triple Whale | E-commerce, Shopify focus | Proprietary pixel + models | Good | From $129/mo |
| Northbeam | DTC brands, MMM + MTA hybrid | Machine learning | Good | Custom pricing |
| RudderStack | Technical teams, warehouse-first | Passes to destinations | Strong (open source option) | Free tier / Growth from $450/mo |
No single tool is “best.” GA4 works if you’re comfortable with Google’s ecosystem and data practices. Matomo or self-hosted options make sense for privacy-focused organizations. CDPs like Segment or RudderStack add flexibility but require more setup.
Common Cross-Channel Analytics Mistakes
After implementing cross-channel tracking across dozens of organizations, these patterns consistently cause problems:
Mistake 1: Inconsistent tracking windows
Facebook uses 7-day click, Google uses 30-day, your email platform uses 14-day. Conversions get counted multiple times or attributed inconsistently. Standardize windows across platforms where possible.
Mistake 2: Ignoring view-through conversions
Display and video often influence without clicks. Excluding view-through data undervalues awareness channels. Include it — but with appropriate windows (1-3 days, not 30).
Mistake 3: Over-engineering too early
Teams build complex data warehouses before proving basic cross-channel value. Start simple: GA4 or Matomo with proper UTMs. Graduate to CDP/warehouse when you hit limitations.
Mistake 4: No single source of truth for conversions
If your CRM, analytics, and ad platforms all define “conversion” differently, cross-channel analysis is meaningless. Define conversions in one place (usually CRM or e-commerce platform) and work backward.
Mistake 5: Attribution without action
Dashboards showing attribution data that nobody uses. The point isn’t having data — it’s making different budget decisions. If nothing changes after implementation, something’s wrong.
Making Budget Decisions with Cross-Channel Data
The goal of cross-channel analytics is better resource allocation. Here’s how to actually use the data:
1. Compare attributed vs. reported conversions
Every ad platform over-reports. Compare their claimed conversions to your unified cross-channel data. The delta shows how much each platform over-credits itself.
2. Calculate true blended CAC
Add up all marketing spend, divide by cross-channel attributed conversions (not platform-reported). This is your real customer acquisition cost.
3. Identify assist-heavy channels
Channels with high assist-to-conversion ratios are undervalued by last-click. Consider maintaining spend even if “direct” ROAS looks weak.
4. Test incrementality
Pause a channel in a specific geo, measure the impact on total conversions. If conversions drop more than that channel’s attributed share, it’s driving incremental value. If they barely move, it might be taking credit for organic demand.
5. Review path analysis before cutting budget
Before reducing spend on a channel, check how often it appears in converting paths. Cutting a frequent assist channel can collapse conversion rates across other channels.
Getting Started: Your First 30 Days
Cross-channel analytics implementation doesn’t require months of work. Here’s a realistic 30-day plan:
Week 1: Audit and document
- List all marketing channels and platforms
- Document current tracking (what’s tagged, what’s missing)
- Identify your conversion source of truth
Week 2: Fix the basics
- Create UTM governance document
- Standardize naming conventions
- Tag untagged campaigns
Week 3: Connect the data
- Set up or verify your analytics platform’s multi-touch reports
- Create channel interaction and path length reports
- Compare platform-reported vs. cross-channel attributed conversions
Week 4: Take action
- Identify one channel being over- or under-valued
- Make a budget adjustment based on cross-channel data
- Document the decision and expected outcome
The goal isn’t perfection — it’s making better decisions than last-click attribution allows.
Key Takeaways
- Cross-channel analytics connects fragmented marketing data to show how channels work together
- Multi-touch attribution models distribute credit across the customer journey — choose based on your sales cycle
- Privacy-compliant implementation uses first-party data, proper consent, and server-side tracking
- Start simple with UTM standardization and built-in multi-touch reports before building complex data infrastructure
- The goal is action: better budget allocation based on complete attribution data, not just dashboards
Cross-channel analytics isn’t about having perfect data — that doesn’t exist. It’s about having better data than single-channel reports provide, and using it to make smarter marketing investments.